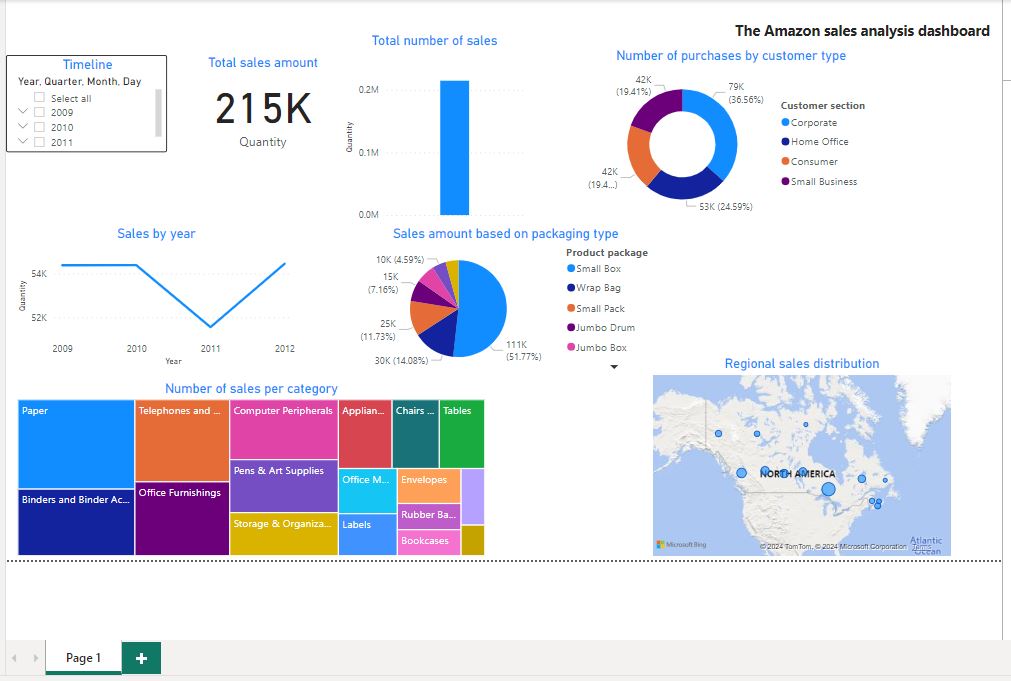
Microsoft Power BI is a business analytics tool provided by Microsoft that enables users to visualize and analyze data, share insights, and make data-driven decisions across an organization. It consists of several components that work together to transform raw data into meaningful information.
Features of the Amazon Data Analysis Project:
- Predefined Stages with Detailed Specifications:
- A structured project with predefined stages and detailed specifications.
- User-Friendly and One-Click Project Setup:
- Easy usability and project setup with a single click.
- High-Speed Data Loading with Optimized Settings:
- Efficient data loading with high-speed performance through optimized settings.
- Cleaned Data Free of Errors:
- Data cleaning to eliminate any mistakes or errors in the dataset.
- Free Dataset Attached to the Project:
- A free dataset provided and attached to the project.
What You Will Find in This Project:
- Access to a Free Dataset with Project Attachment:
- Access to a complimentary dataset included with the project.
- Access to Cleaned and Curated Data from the Mentioned Dataset:
- Access to data that has been collected, cleaned, and curated from the specified dataset.
- Access to a Ready-Made Data Analysis Project:
- Access to a project that is prepared for data analysis from the mentioned dataset.
- Access to a Professional Data Analysis and Visualization Project with Power BI:
- Access to a professional project for data analysis and visualization using Power BI.
Analyzing Amazon data using Power BI involves several steps to gain valuable insights. Here’s a simplified guide:
1. Data Collection:
- Gather your Amazon store data, including sales, product details, and customer reviews.
2. Data Import:
- Open Power BI Desktop and use connectors to import your data (e.g., Excel, CSV, or Amazon API).
3. Data Cleaning and Transformation:
- Clean and transform data, handle missing values, and create calculated columns.
- Extract keywords or sentiments from product descriptions using Power BI tools.
4. Data Modeling:
- Create relationships between tables if you have multiple data sources.
- Define calculated columns or measures for key performance indicators (KPIs).
5. Dashboard Design:
- Build a dashboard with visualizations showing key metrics.
- Use charts, tables, and visuals to represent product performance, customer reviews, and relevant information.


Reviews
There are no reviews yet.