The Educational Institutes Analytics Dashboard is a comprehensive data analysis solution designed to help educational institutions streamline their operations and enhance decision-making through real-time insights. Developed by Digitalyar Company, this powerful dashboard integrates key metrics across various aspects of institutional performance, offering a detailed and visually engaging overview of academic performance, student demographics, financial health, and instructor effectiveness.
With interactive charts and reports, the dashboard empowers administrators, faculty, and decision-makers to make informed choices that directly impact student success, financial sustainability, and overall institutional growth.
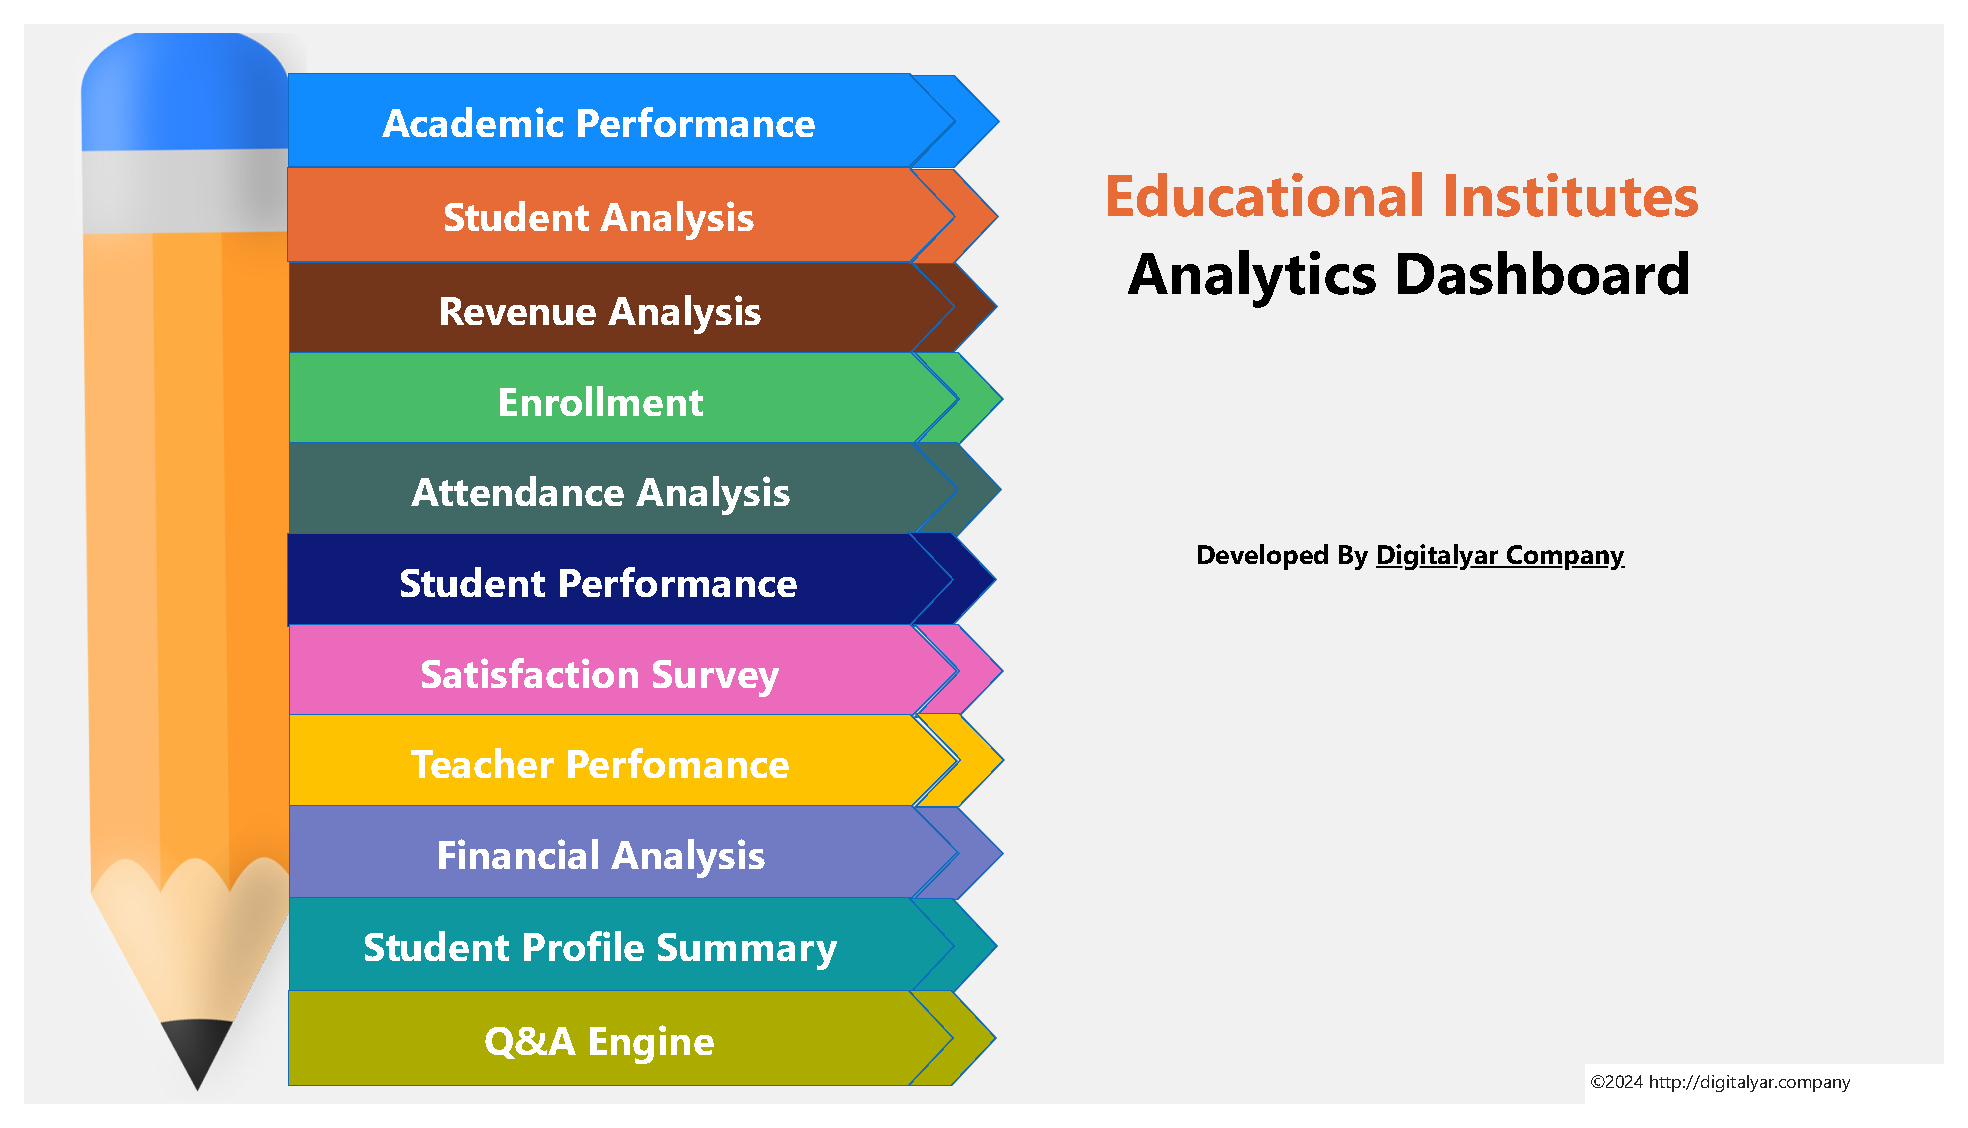
Key Features:
- Academic Performance: Track student outcomes, pass/fail rates, and academic progress across different courses. Identify areas for improvement and ensure students meet their learning goals.
- Student Analysis: Gain insights into student demographics, including age, gender, nationality, and enrollment trends. Tailor programs and services to diverse student needs for better retention.
- Revenue Analysis: Monitor income and expenses by course, term, and month. Analyze tuition growth trends, profit and loss per course, and optimize financial strategies to improve profitability.
- Enrollment Management: Track new and returning students over time, assess the impact of marketing strategies, and understand seasonal enrollment trends to enhance recruitment efforts.
- Attendance Analysis: Keep track of student attendance rates, identify frequent absentees, and improve engagement strategies to boost retention and performance.
- Student Performance: View detailed student performance reports across terms, courses, and instructors, helping you identify students needing extra support or intervention.
- Satisfaction Survey: Analyze student feedback and satisfaction levels to refine courses, instruction quality, and overall institutional services.
- Teacher Performance: Evaluate instructor performance based on student surveys and pass/fail rates. Identify top-performing educators and those in need of additional support or development.
- Financial Management: Manage student debts, discounts, and payment histories to ensure financial sustainability and improve cash flow management.
- Student Profile Summary: Access a comprehensive view of each student’s academic and financial journey, helping in personalized student management and support.
- Q&A Engine: Access real-time data and insights on institutional performance for faster decision-making and effective problem-solving.
Below is a summary of the fields used in the dashboard, along with a brief description of each:
- StudentID: Unique identification code for each student.
- FirstName / LastName: Student’s first and last name.
- DateOfBirth: Student’s date of birth in the Gregorian calendar.
- Gender: Student’s gender (male or female).
- PhoneNumber: Student’s contact number.
- RegistrationDate: Date of enrollment in the course.
- CourseID: Unique identification code for each course.
- CourseName / Description: Name and description of the course.
- StartDate / EndDate: Start and end dates of the course.
- InstructorID: Unique identification code for the instructor.
- InstructorName: Name of the course instructor.
- EducationLevel: Instructor’s academic degree.
- CourseFee: Fee to attend the course.
- Term: Academic term associated with the course.
- InstructorCommission: Percentage of the course fee paid to the instructor as commission.
- AttendanceID: Unique attendance identifier.
- ClassDate: Date of each class session.
- AttendanceStatus: Student’s attendance status (present, absent).
- GradeID: Unique identifier for the grade.
- ExamDate: Date of the course exam.
- Score: Grade achieved by the student.
- Recommendation: Student’s recommendation to take the course.
- PaymentID: Unique payment identifier.
- Amount: Amount paid by the student.
- PaymentDate: Date of payment.
- PaymentMethod: Type of payment (cash, check).
- RemainingDebt: Remaining amount owed by the student for the course.
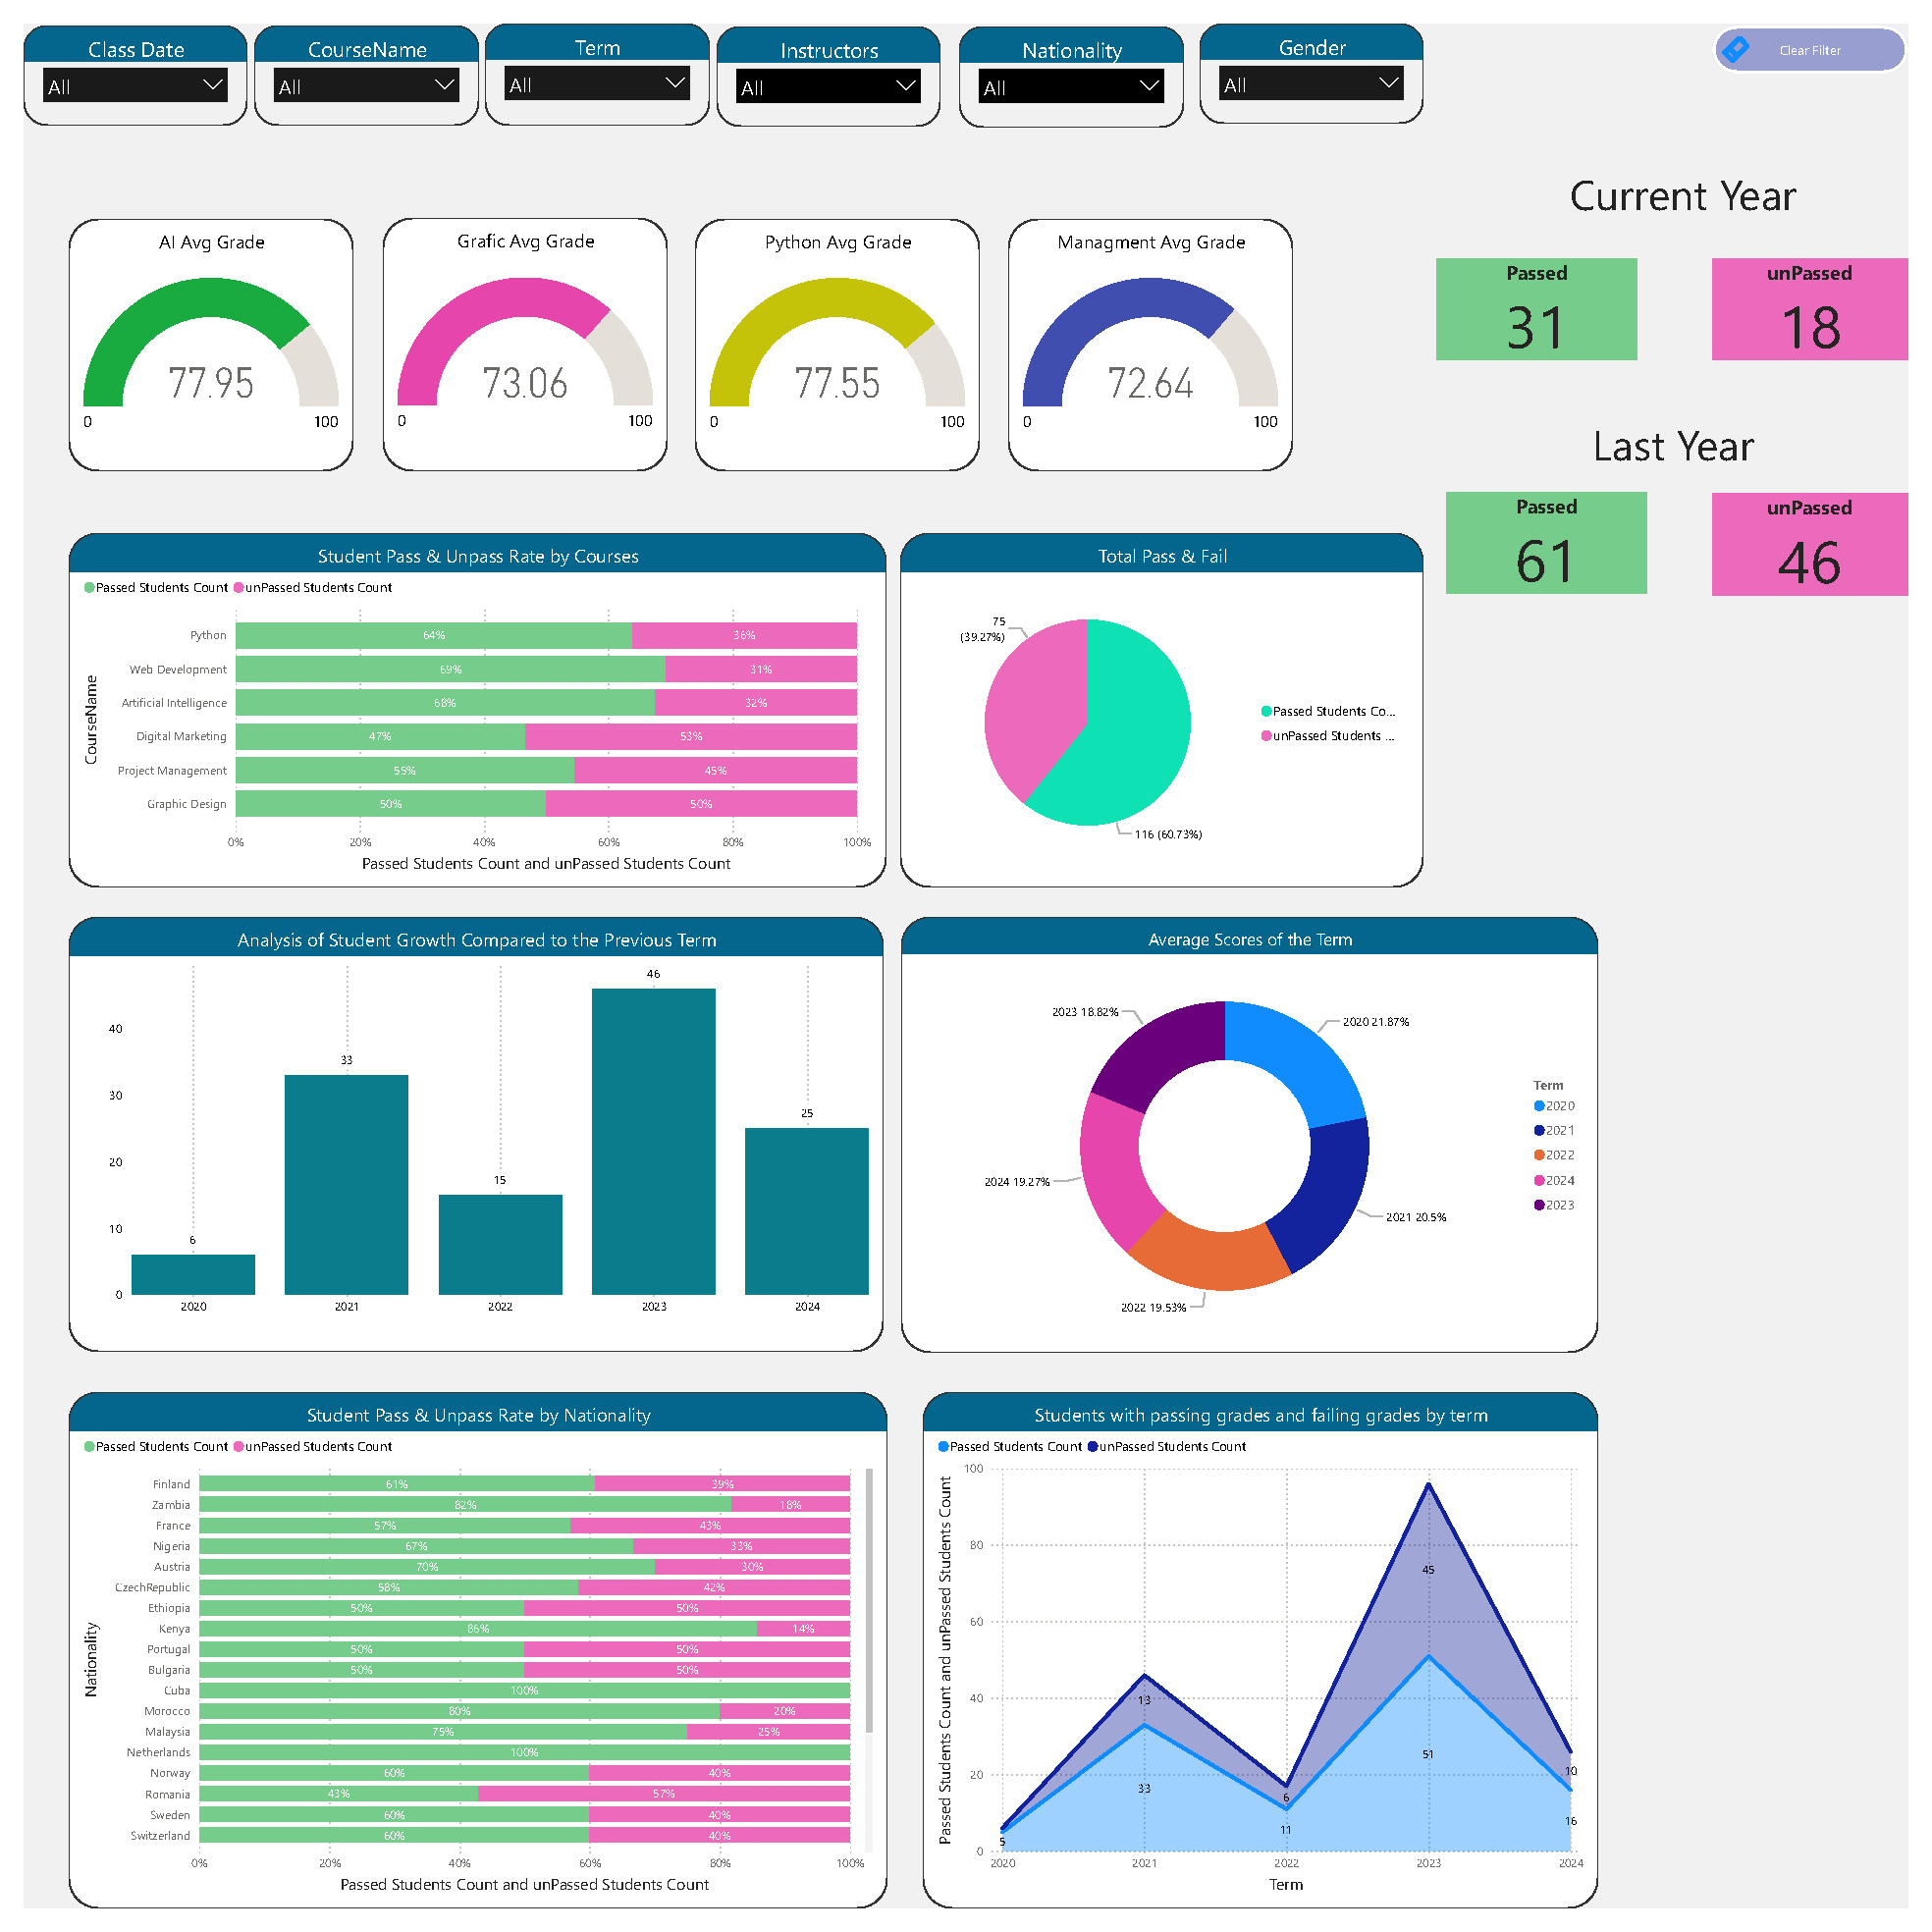
Page 1: Academic Performance
- Purpose: This section provides insights into students’ academic outcomes, including their scores, pass/fail rates, and the overall academic performance across courses. This page is crucial for evaluating the quality of education and identifying areas for improvement in course delivery and student support.
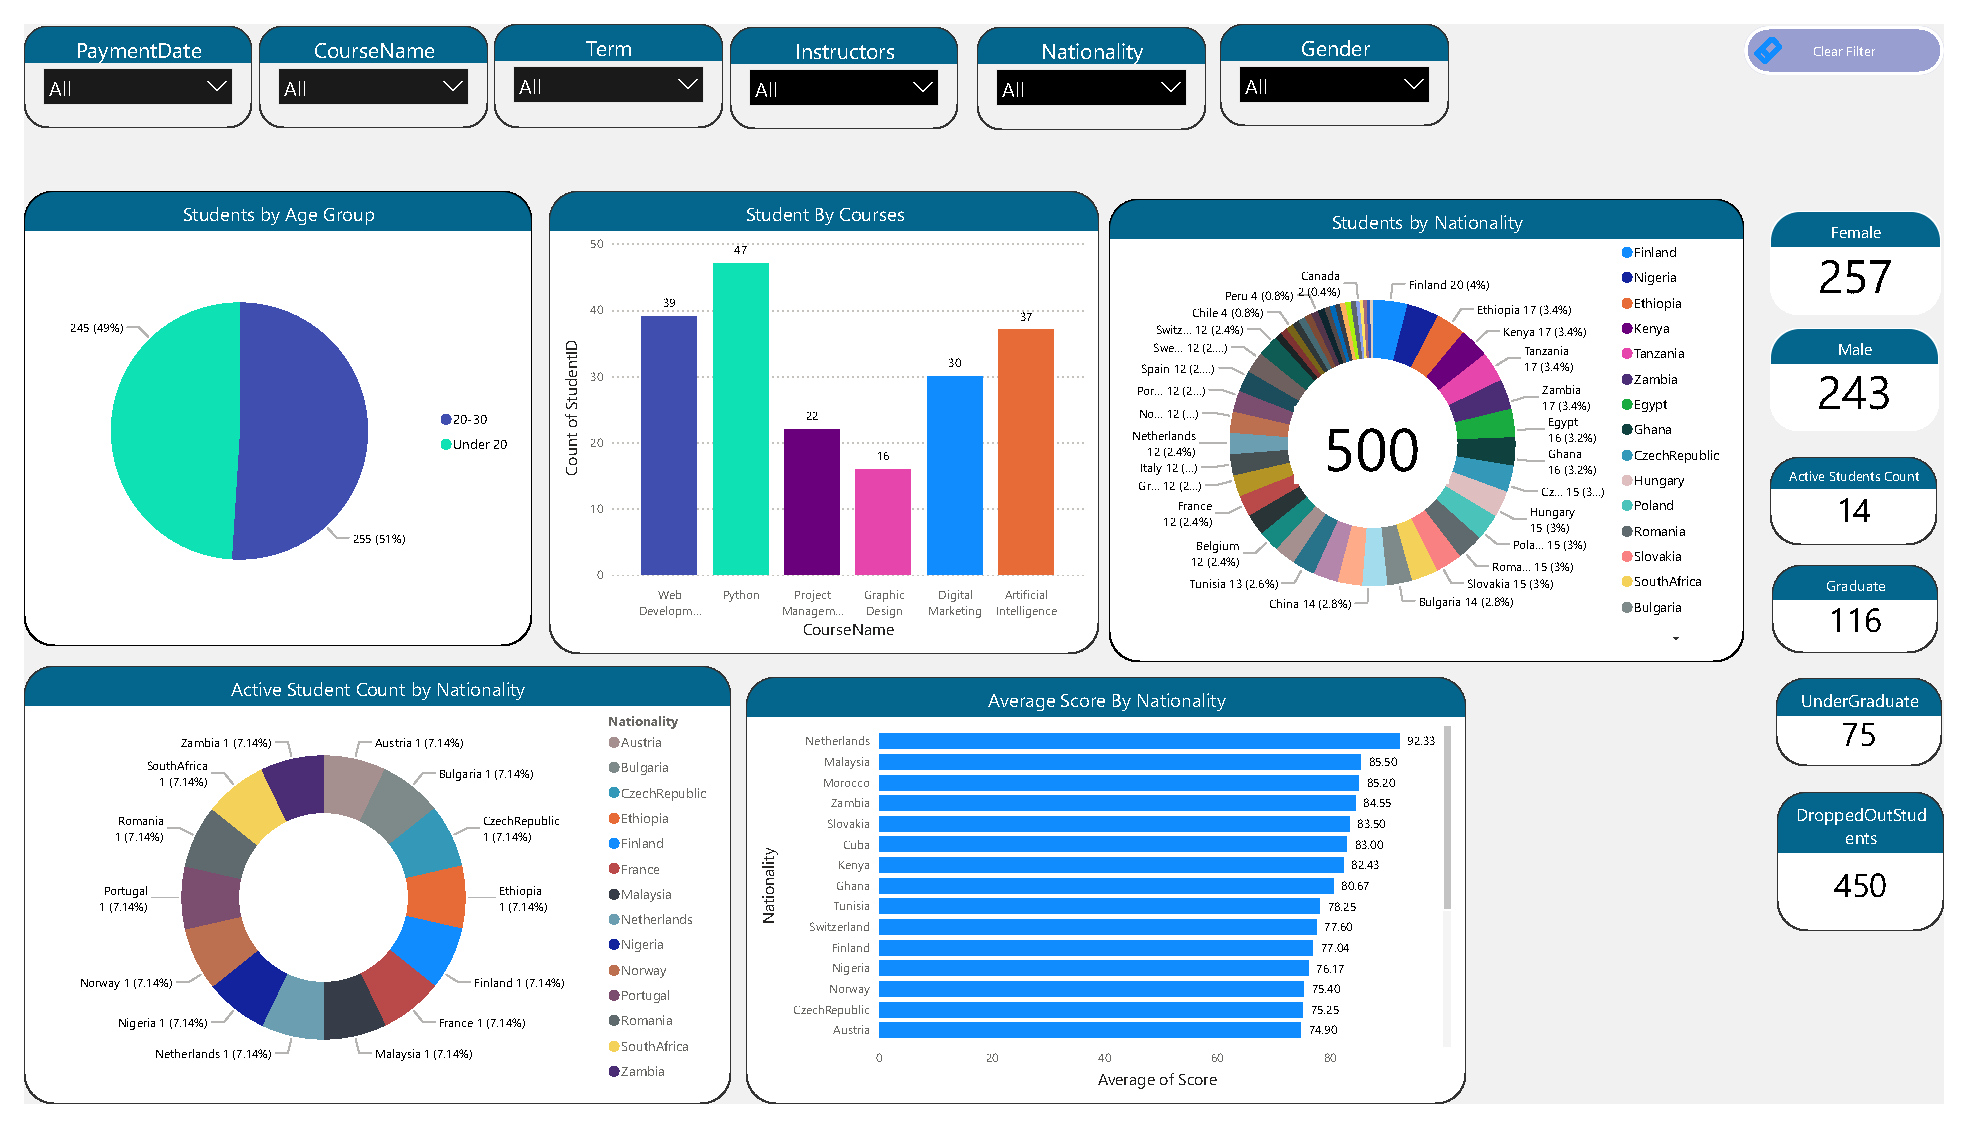
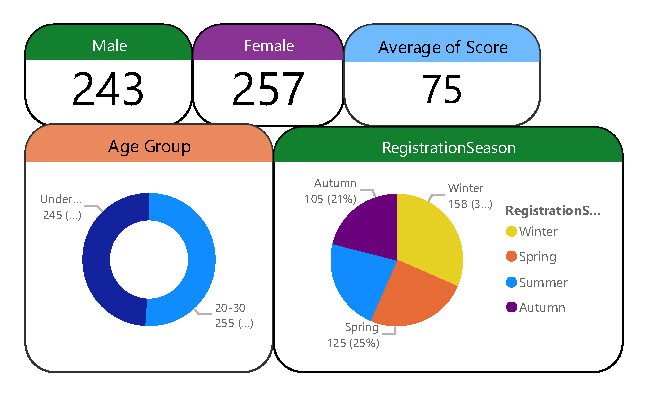
Page 2: Student Analysis
- Purpose: This section offers a detailed breakdown of student demographics such as age, gender, nationality, and enrollment patterns. It helps institutions understand the composition of their student body and tailor their services and programs accordingly to meet diverse student needs.
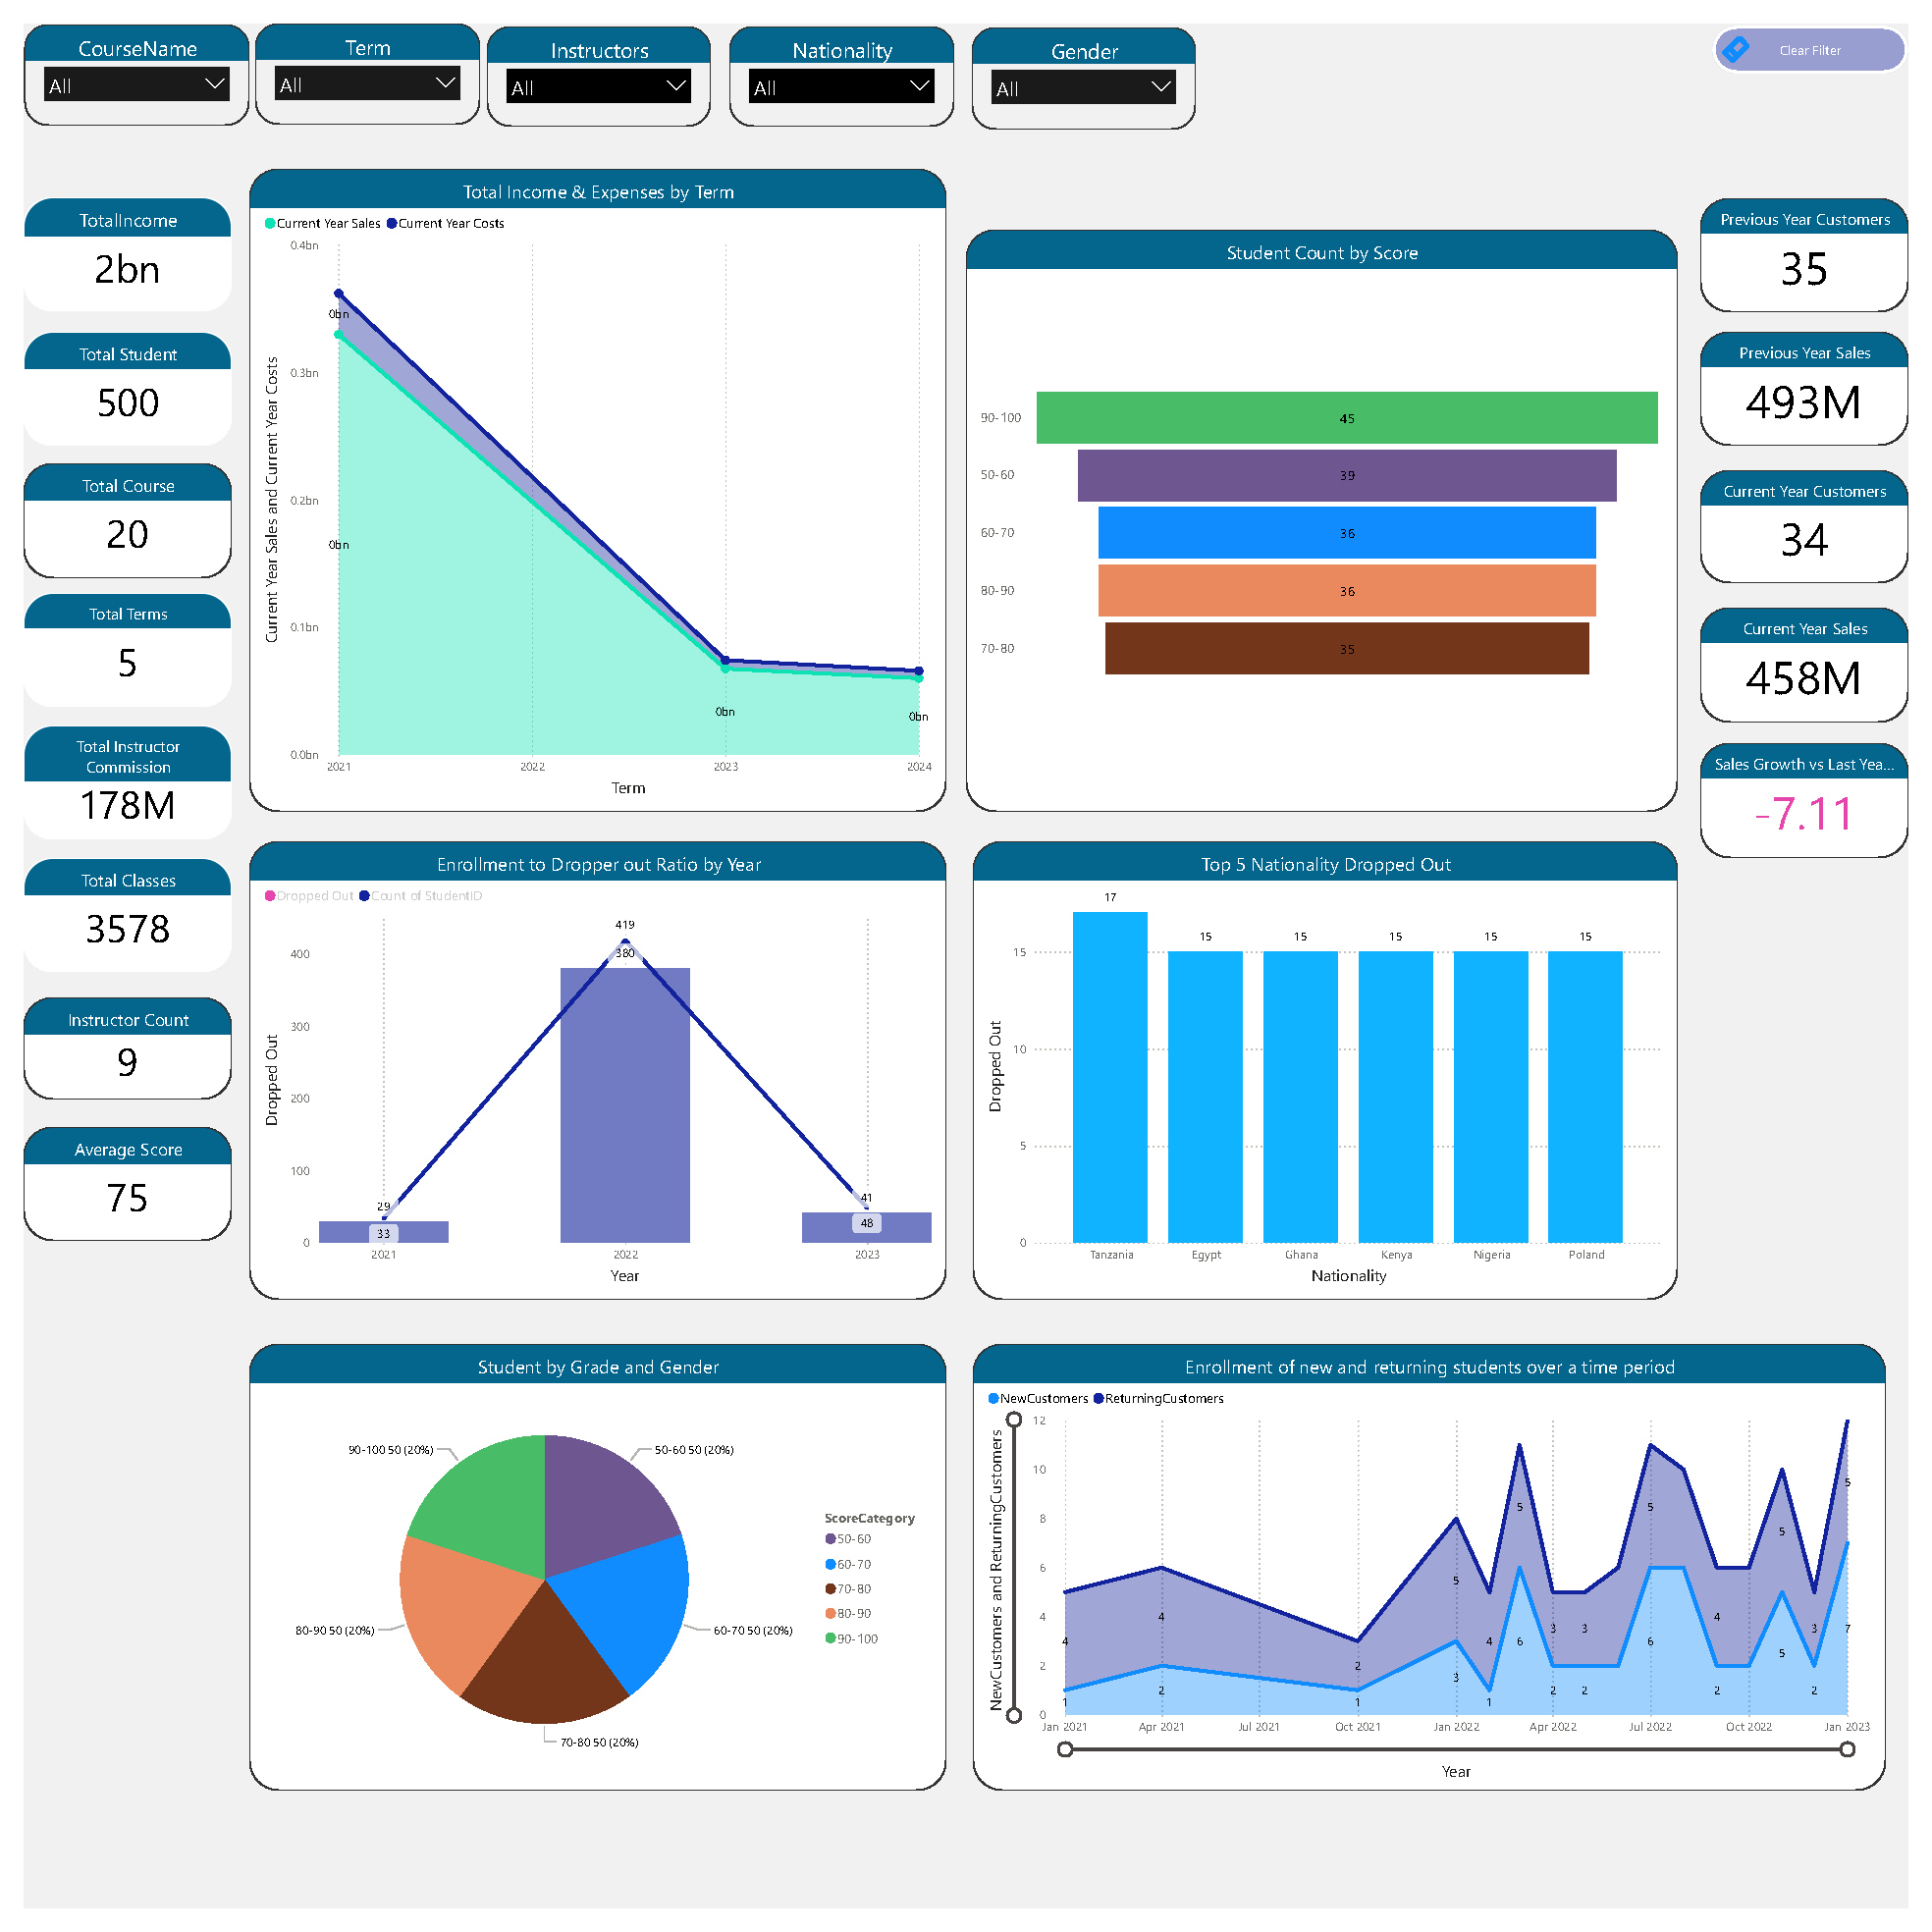
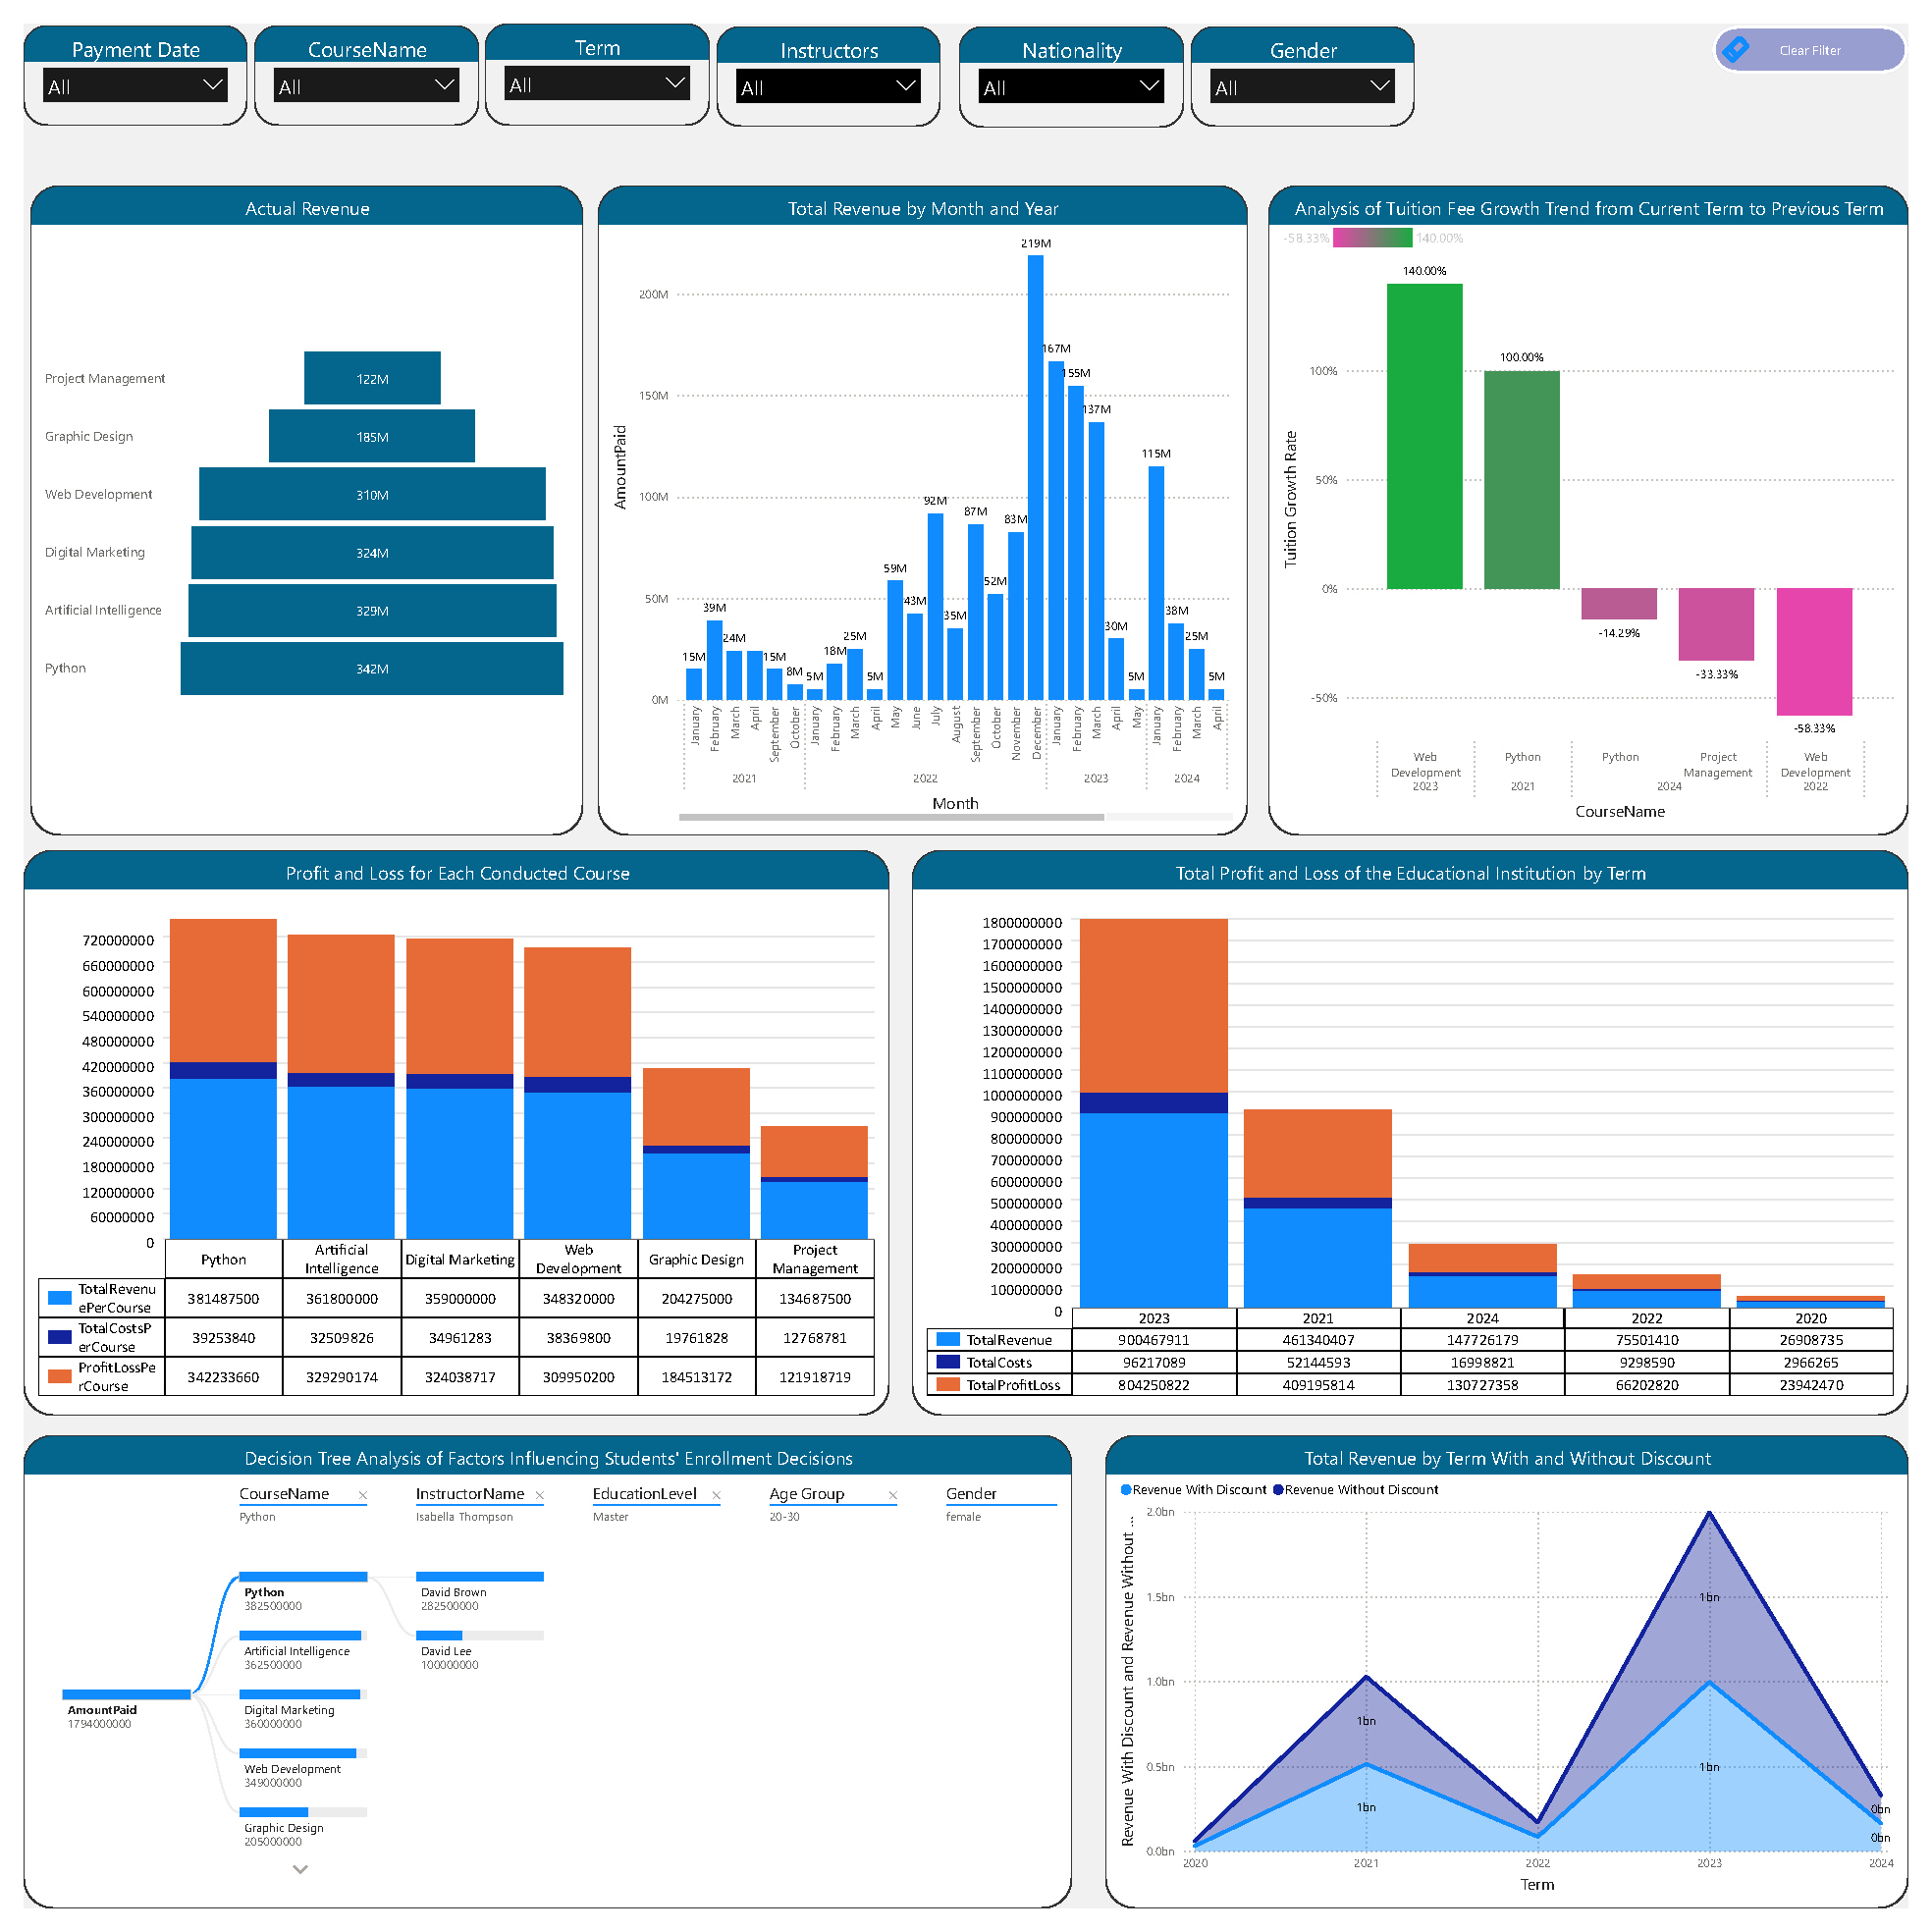
Page 3: Revenue Analysis
- Purpose: The financial health of the institution is analyzed here, covering income and expenses by course, month, and term. This page helps management track the profitability of courses and identify financial trends to optimize resource allocation and financial planning.
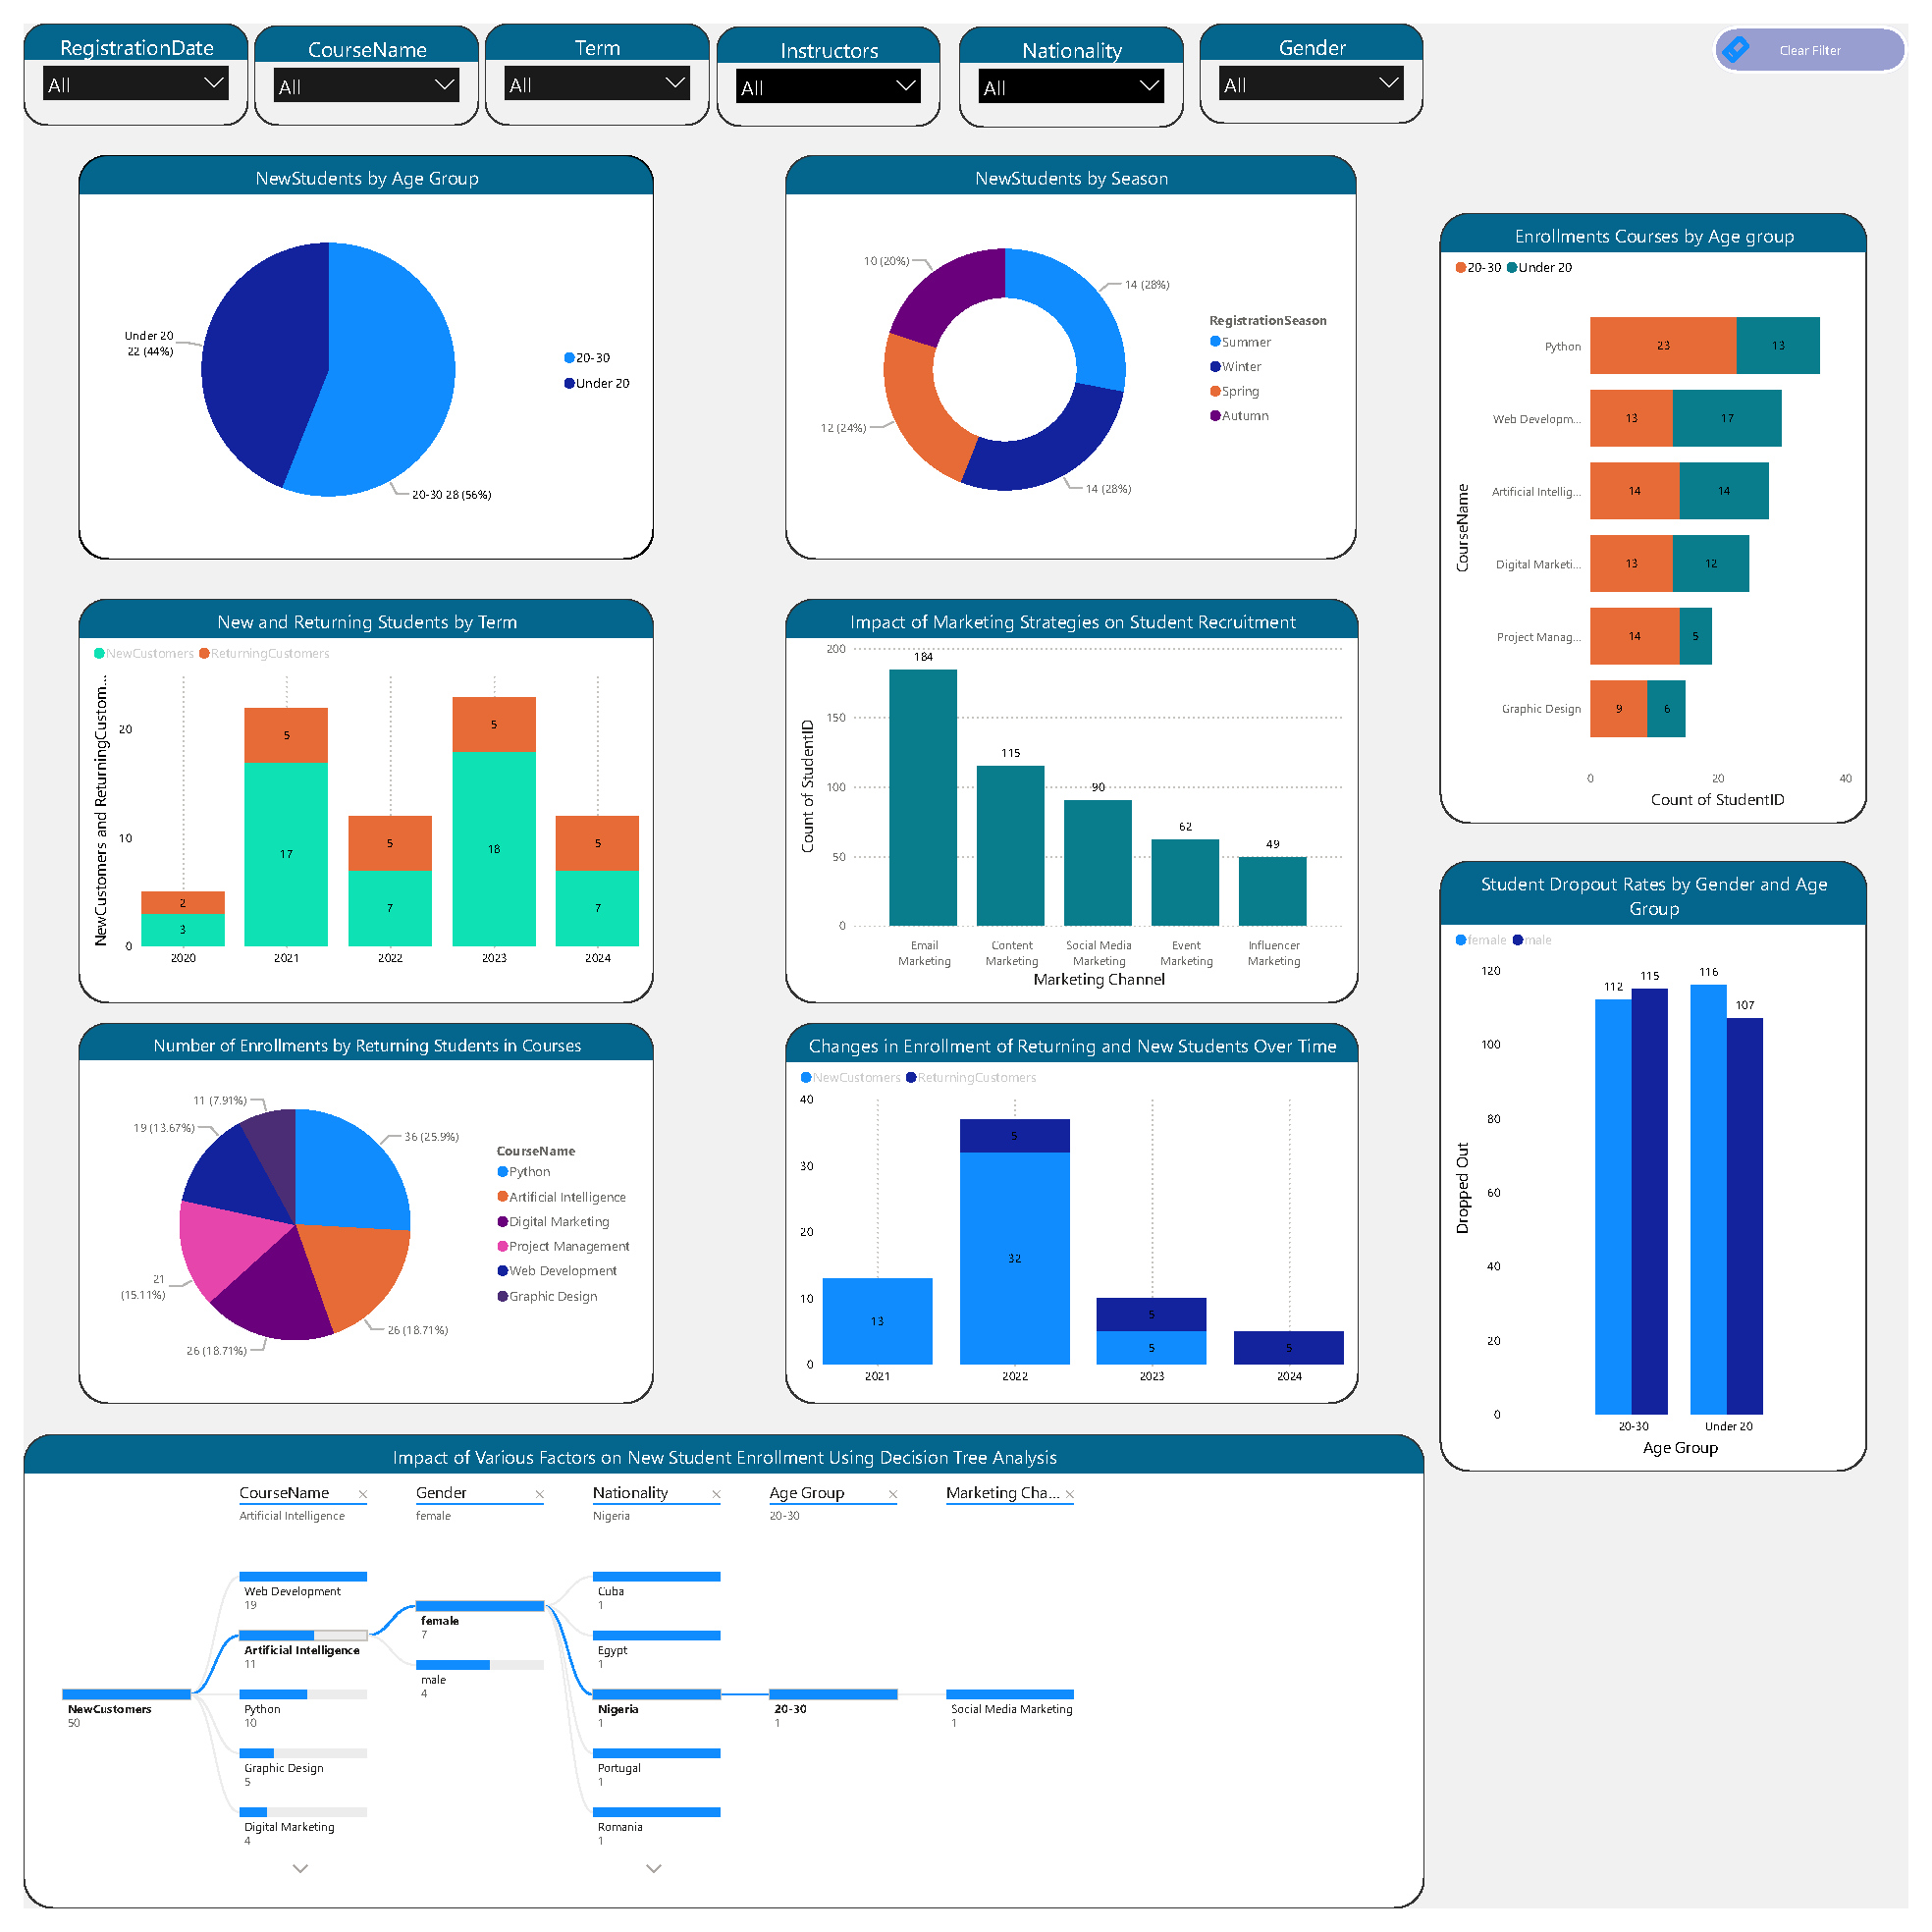
Page 4: Enrollment
- Purpose: This section focuses on enrollment data, tracking new and returning students, and analyzing how different factors such as marketing strategies, age groups, and seasons influence student recruitment. It is essential for institutions aiming to boost their enrollment numbers and retain students.
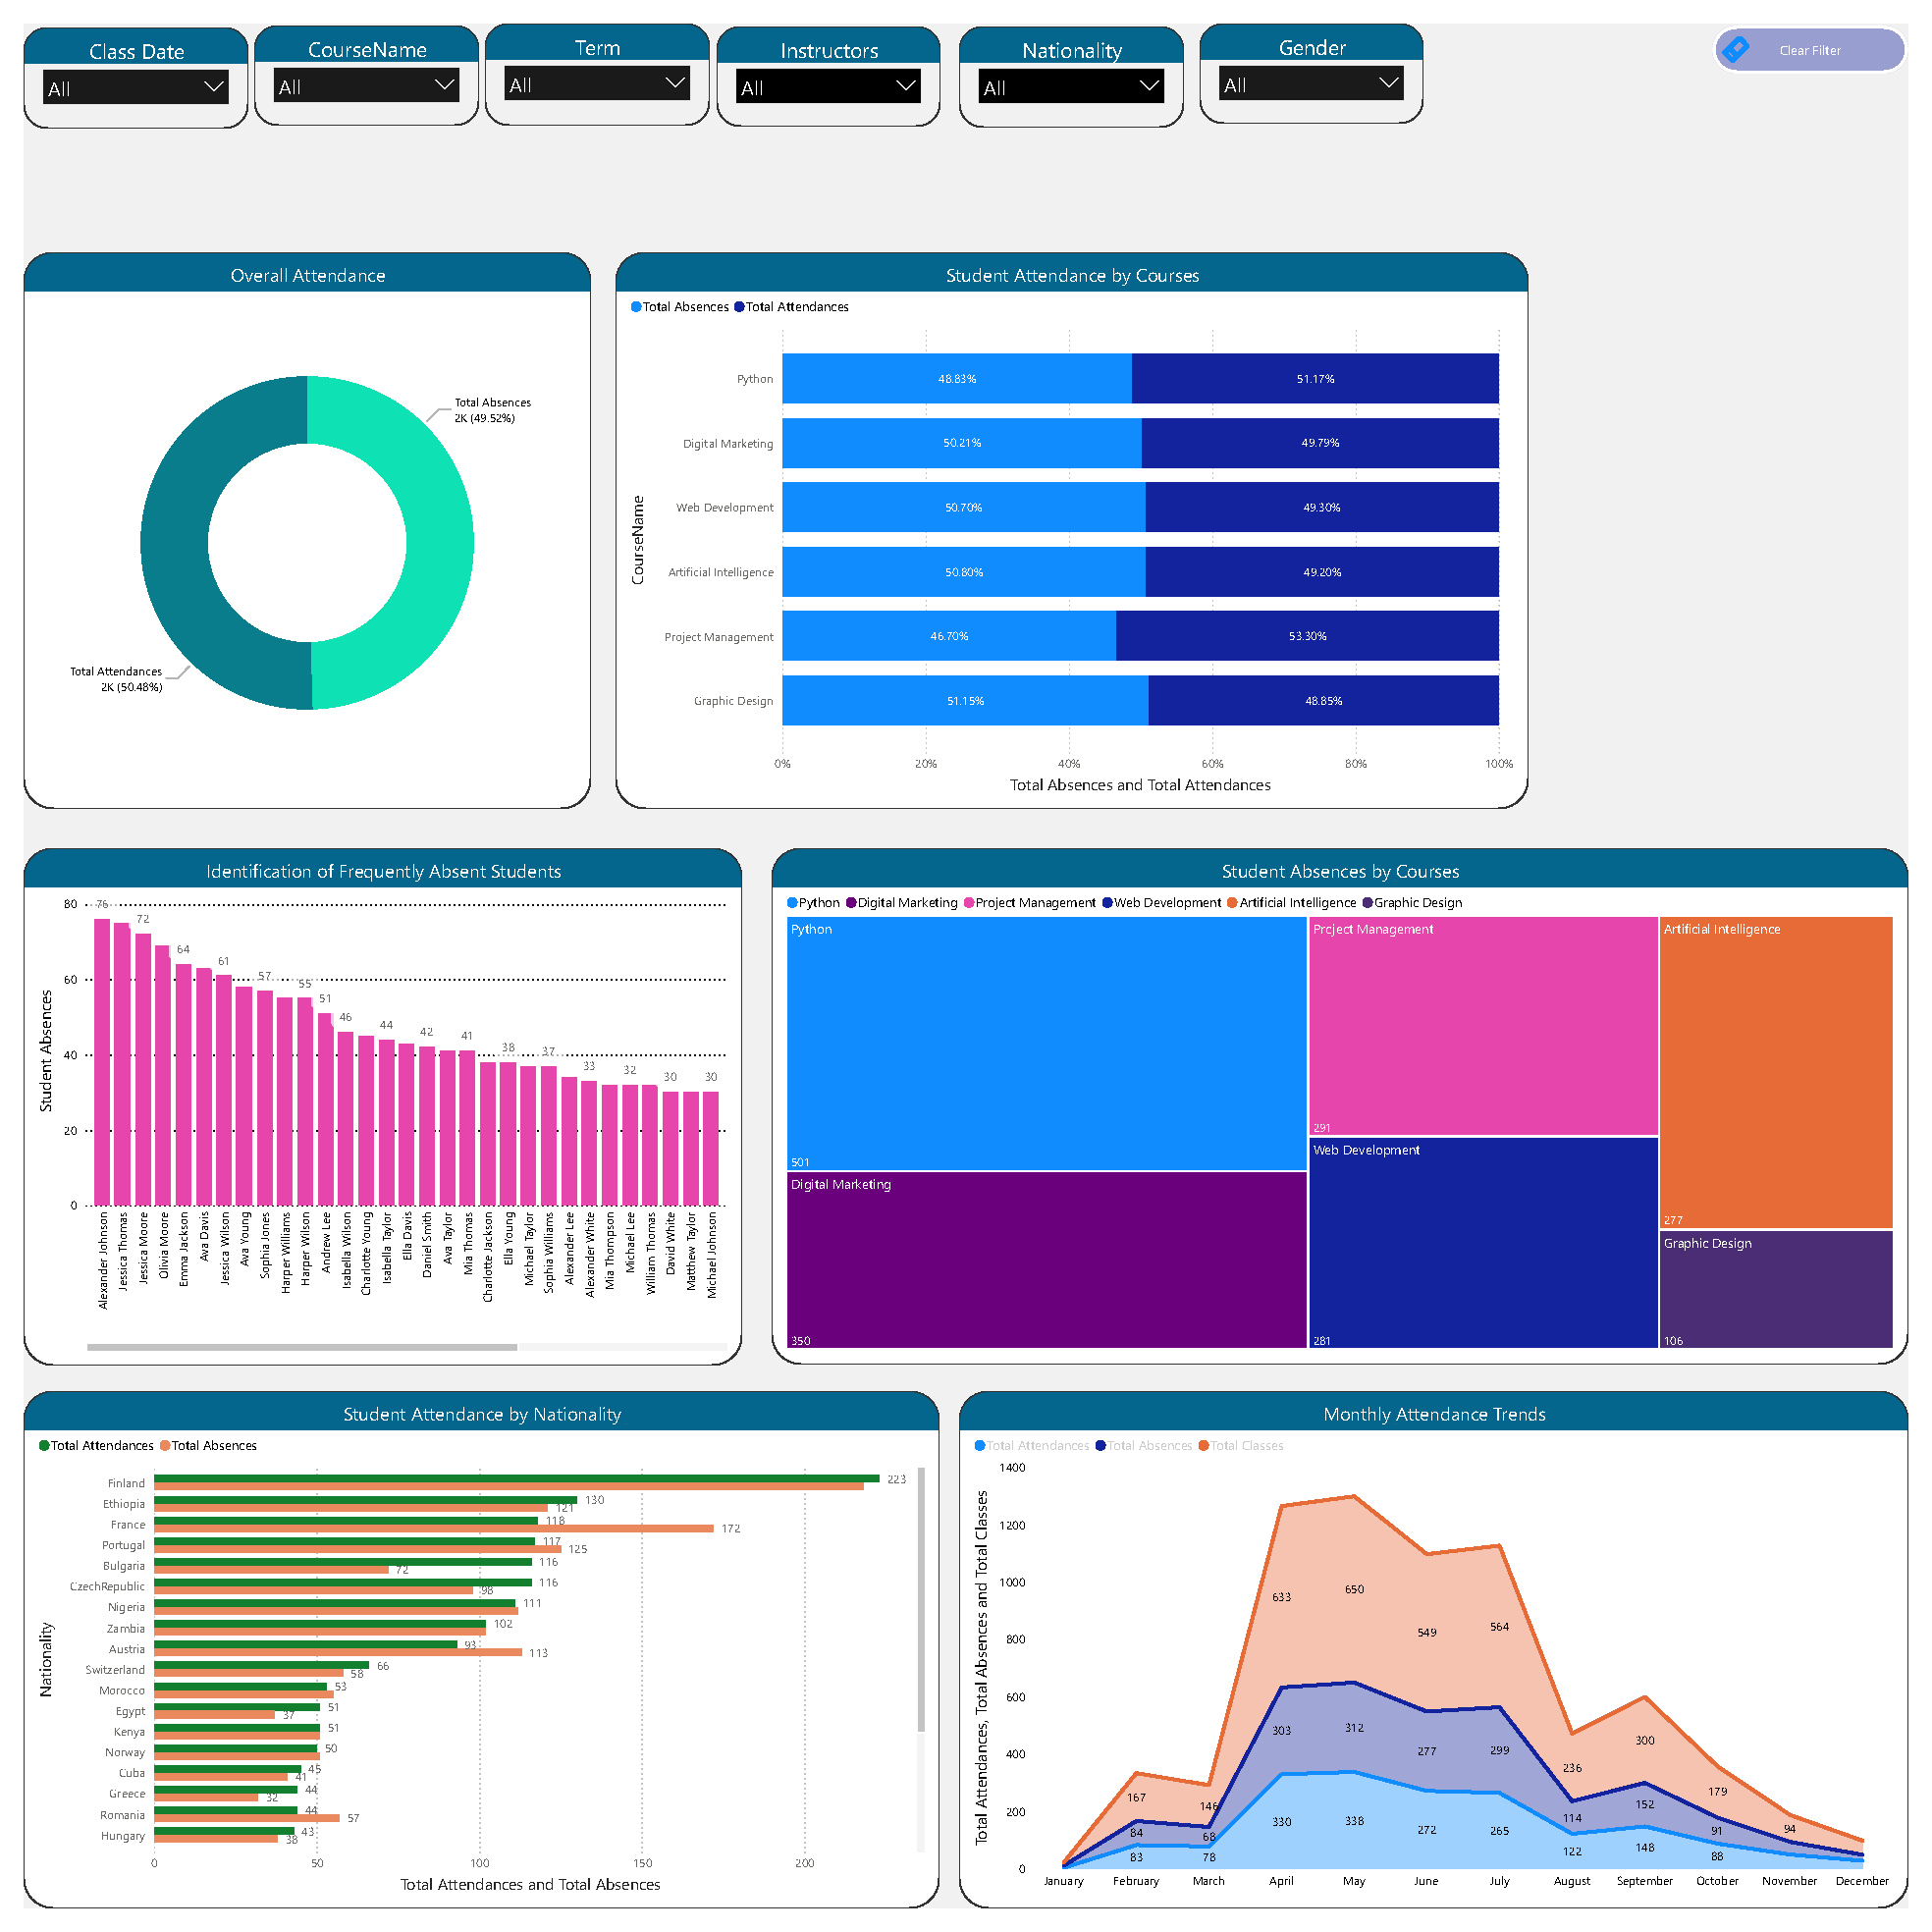
Page 5: Attendance Analysis
- Purpose: This page provides an overview of student attendance, both overall and by course or nationality. By identifying attendance trends and frequently absent students, institutions can take proactive steps to improve engagement and reduce dropout rates.
Page 6: Student Performance
- Purpose: This page offers detailed reports on individual student performance, tracking their progress over time and across different terms. It enables institutions to focus on student outcomes and provides insights for personalized support and intervention strategies.
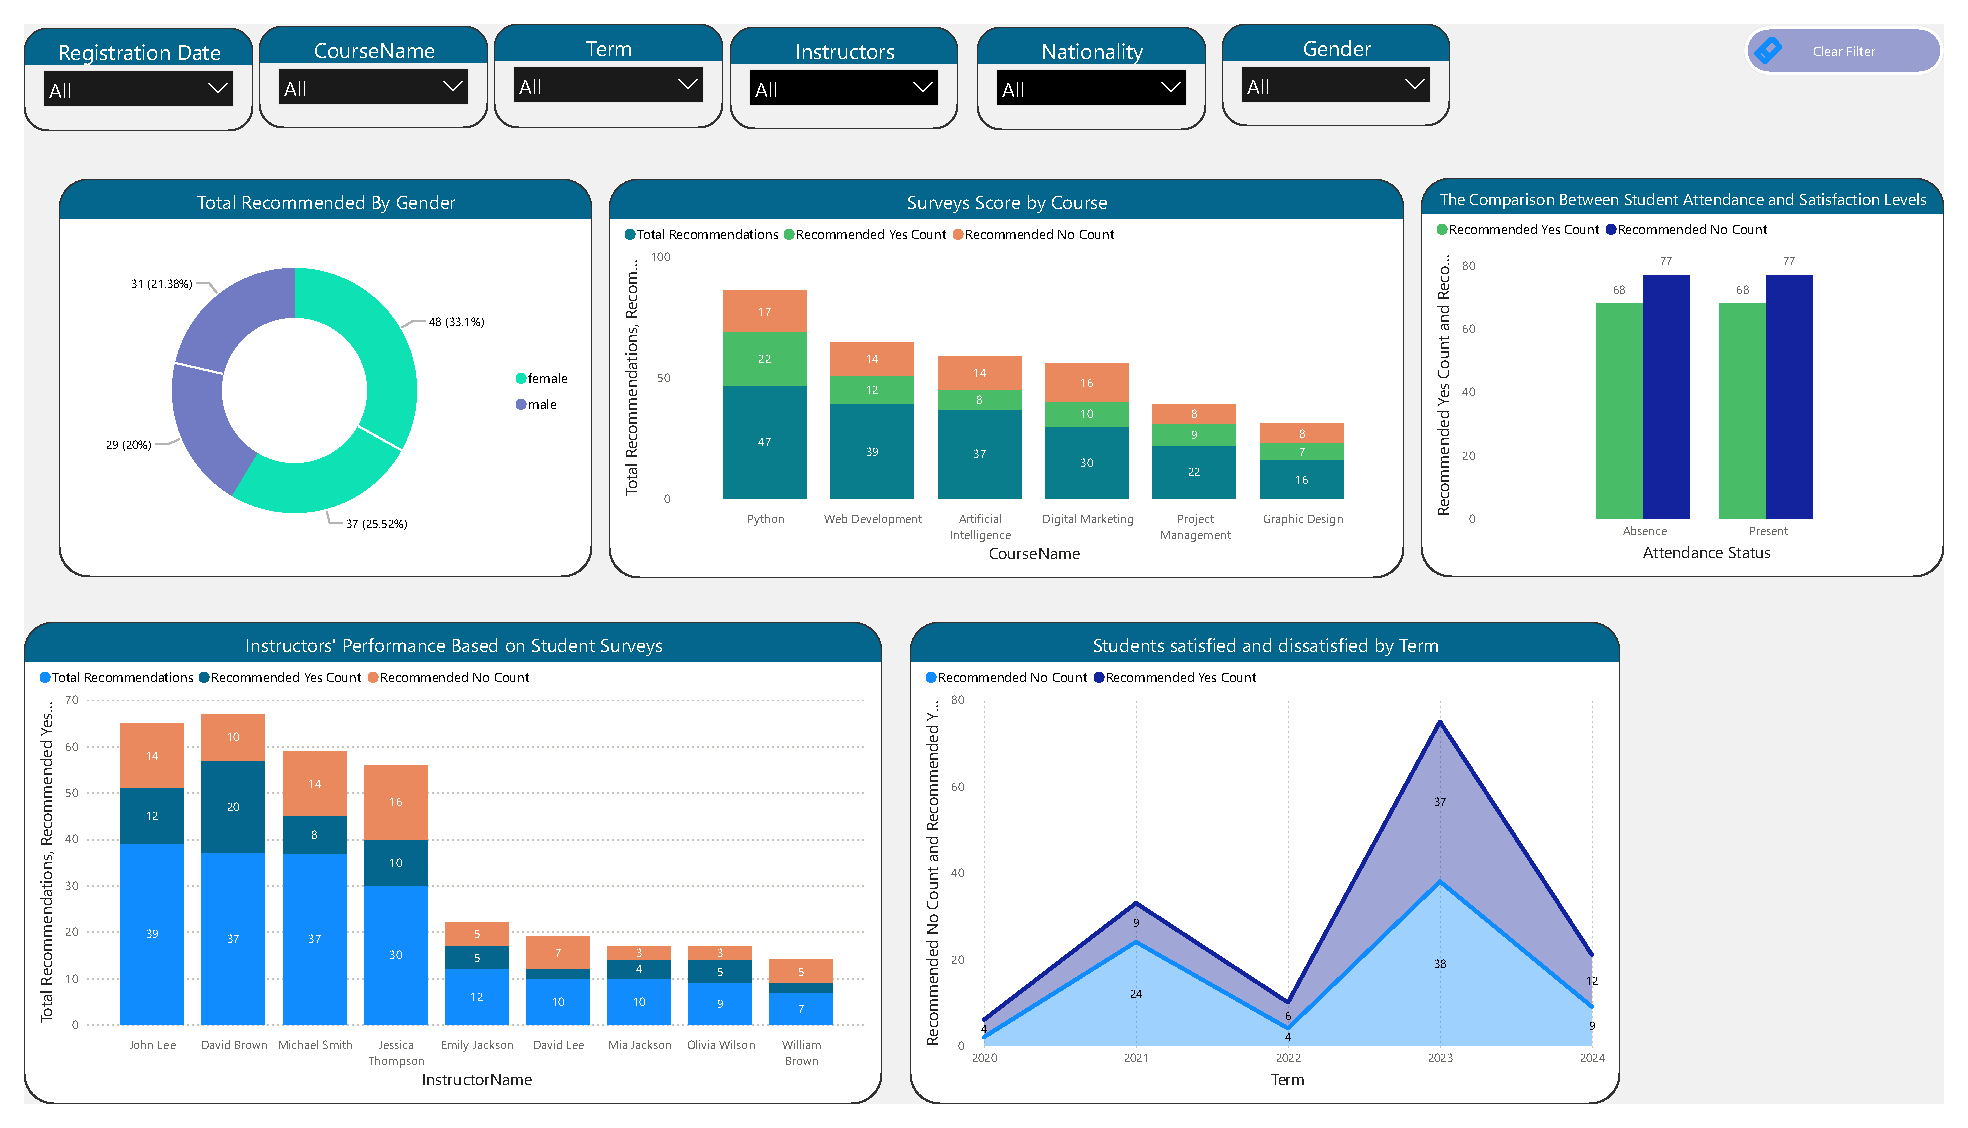
Page 7: Satisfaction Survey
- Purpose: This page displays student feedback and satisfaction survey results. It provides actionable insights into how students perceive the quality of instruction, courses, and overall experience. Institutions can use this data to enhance student satisfaction and improve their services.
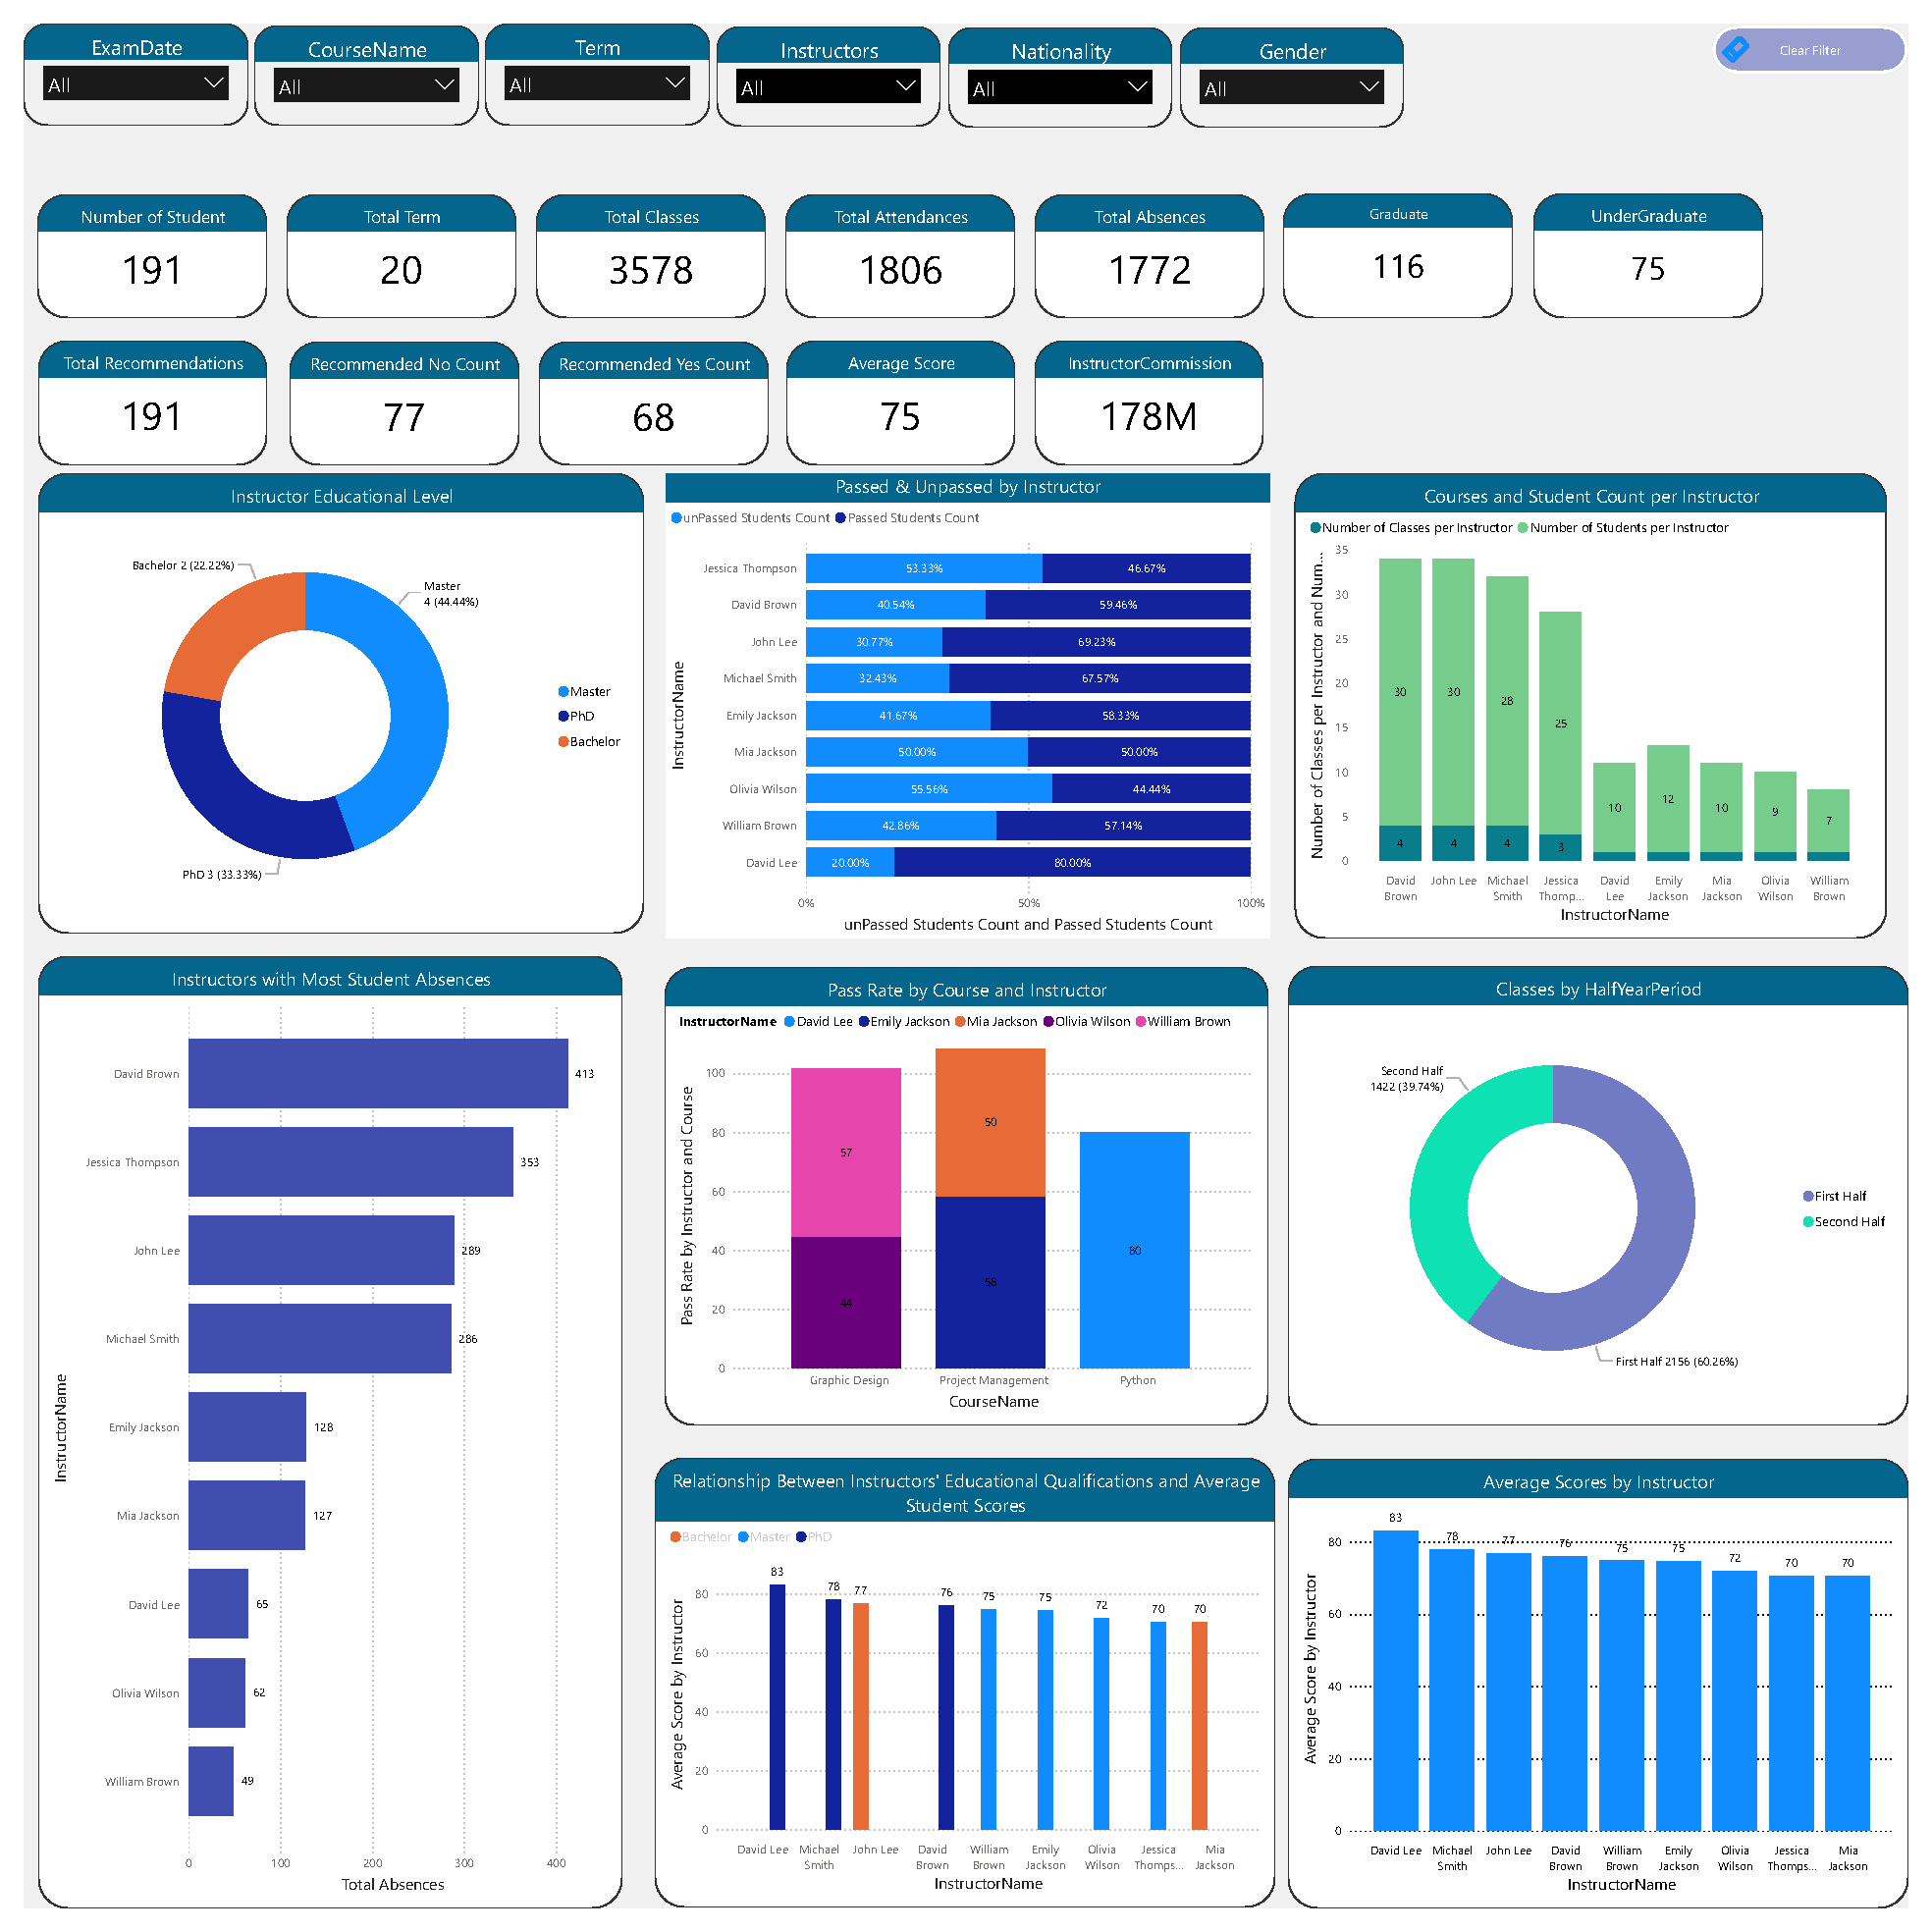
Page 8: Teacher Performance
- Purpose: This section evaluates instructor performance based on student surveys and academic results. It helps management assess teaching quality, identify top-performing instructors, and determine areas where additional training or support may be needed.
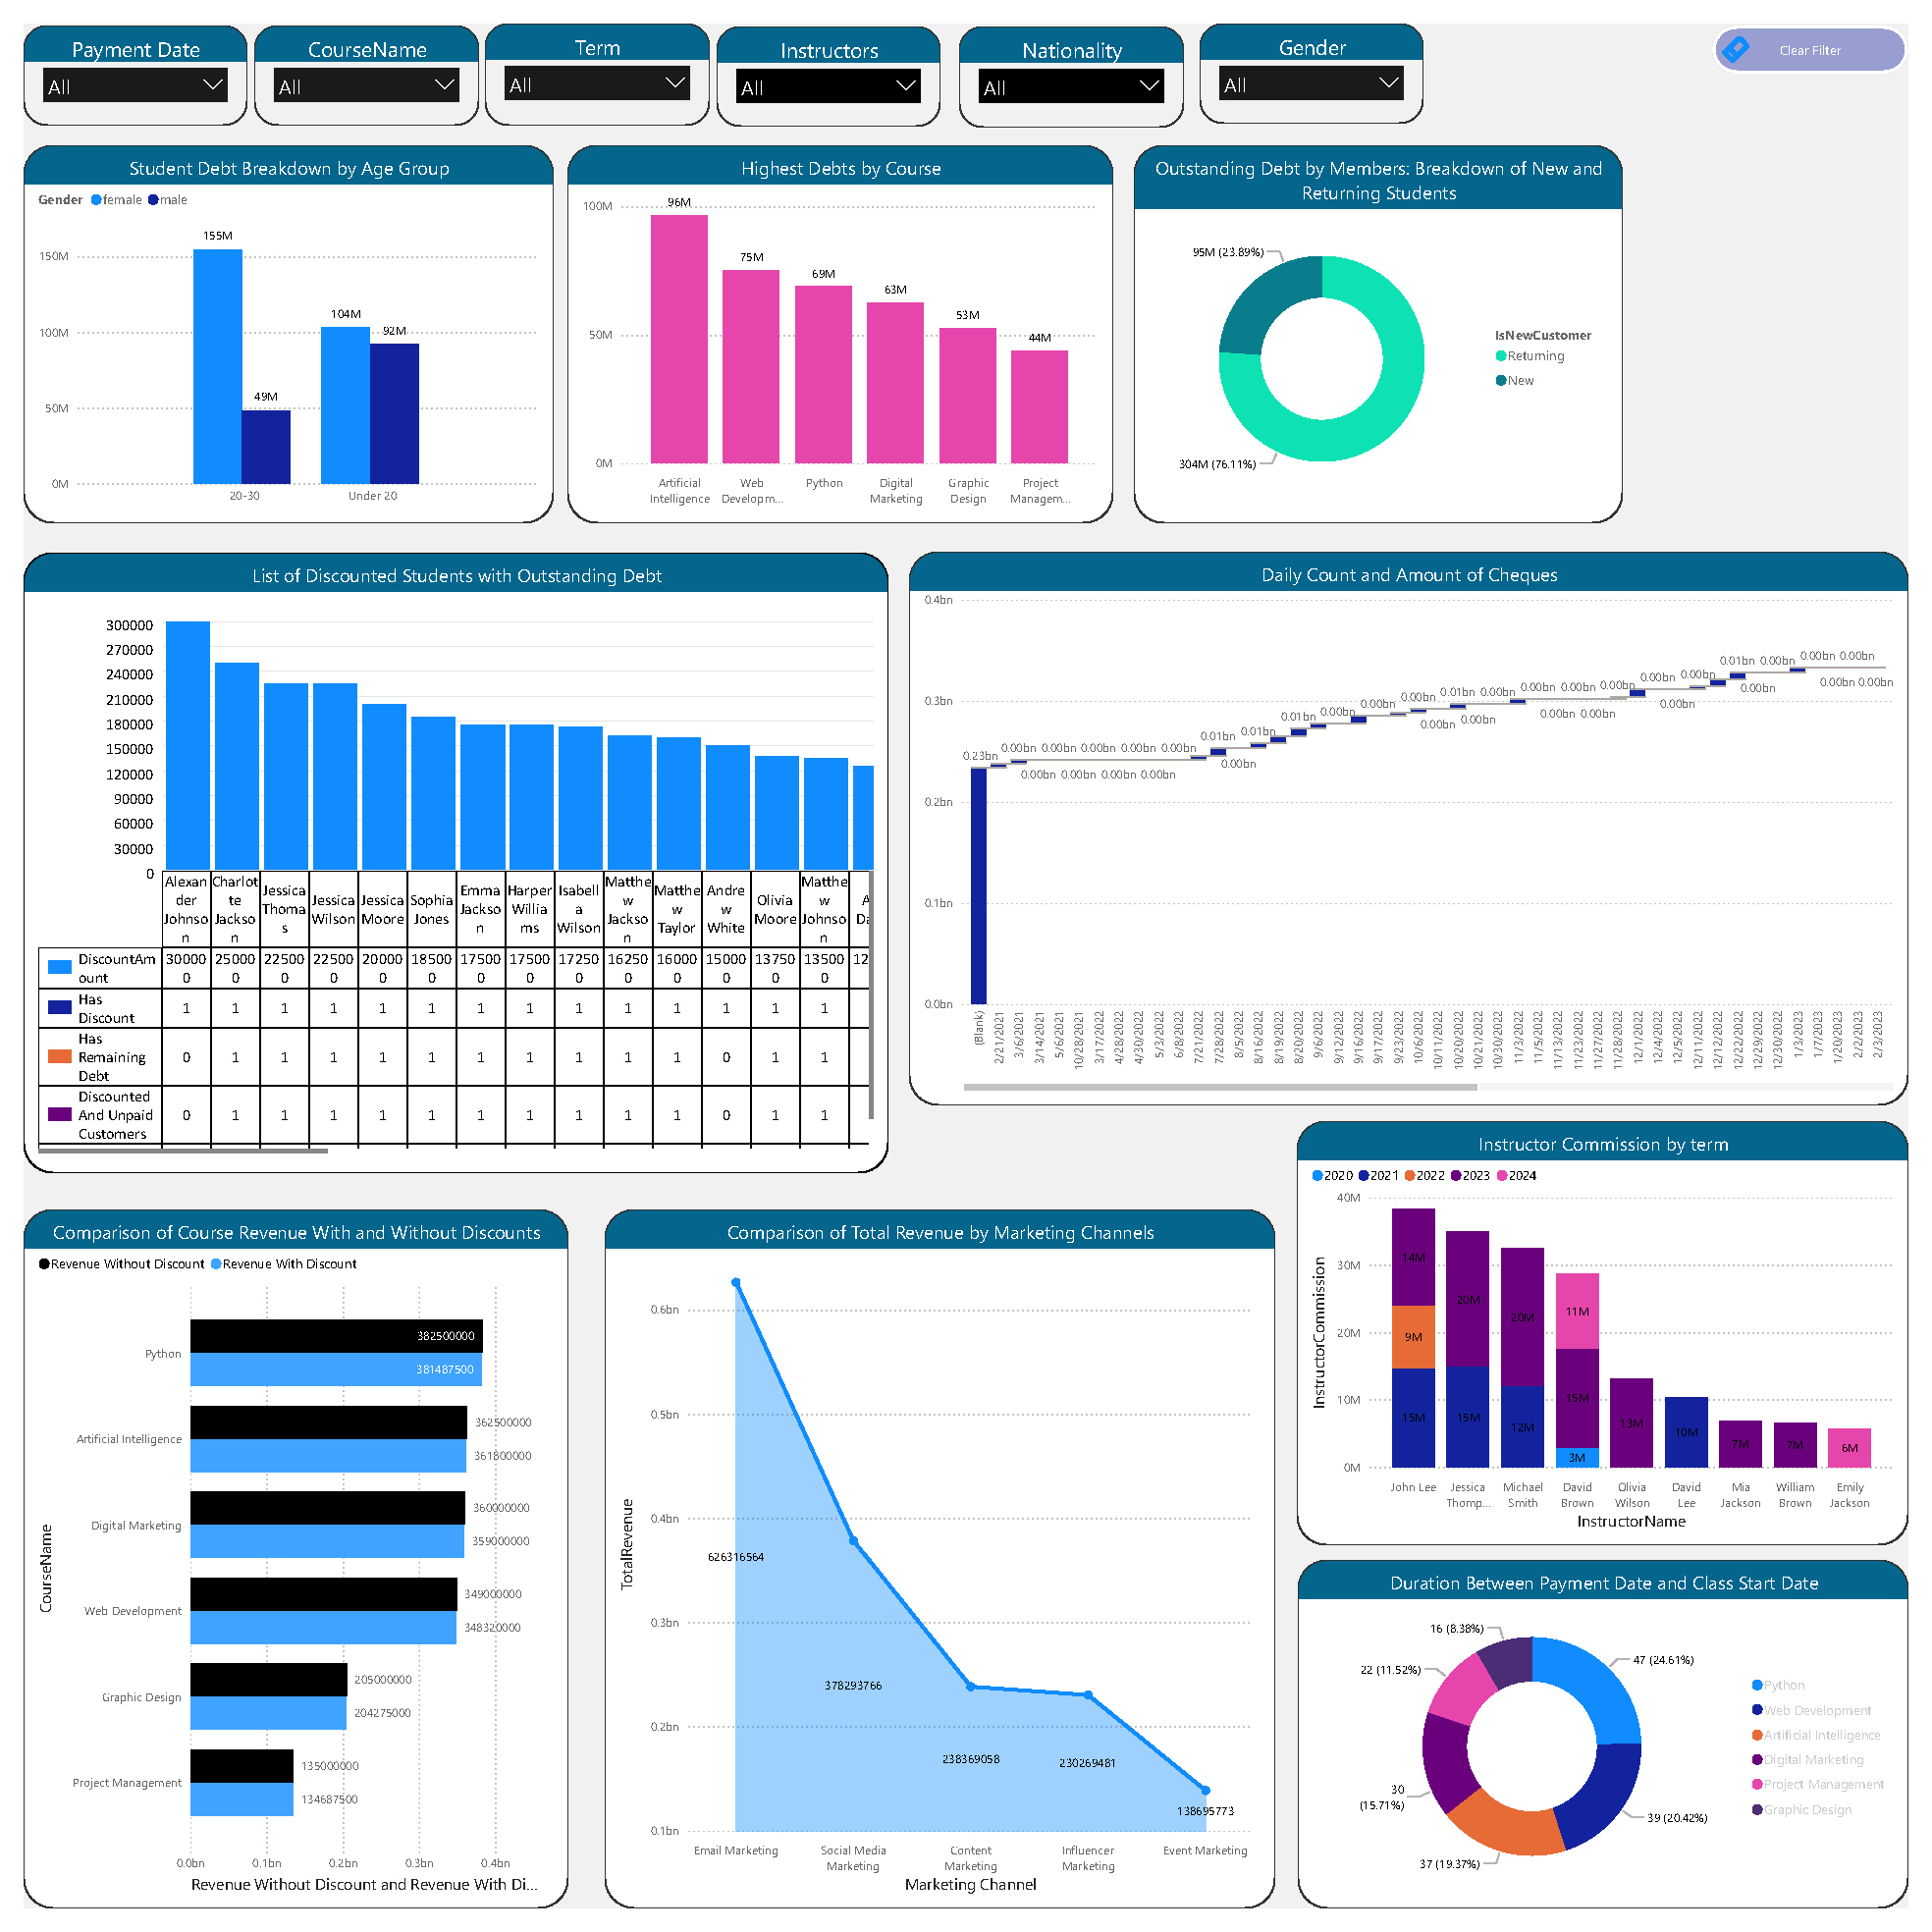
Page 9: Financial Analysis
- Purpose: This section focuses on the institution’s financial performance, covering aspects such as student debts, discounts, and payment histories. It is essential for managing financial sustainability and ensuring students meet their financial obligations.
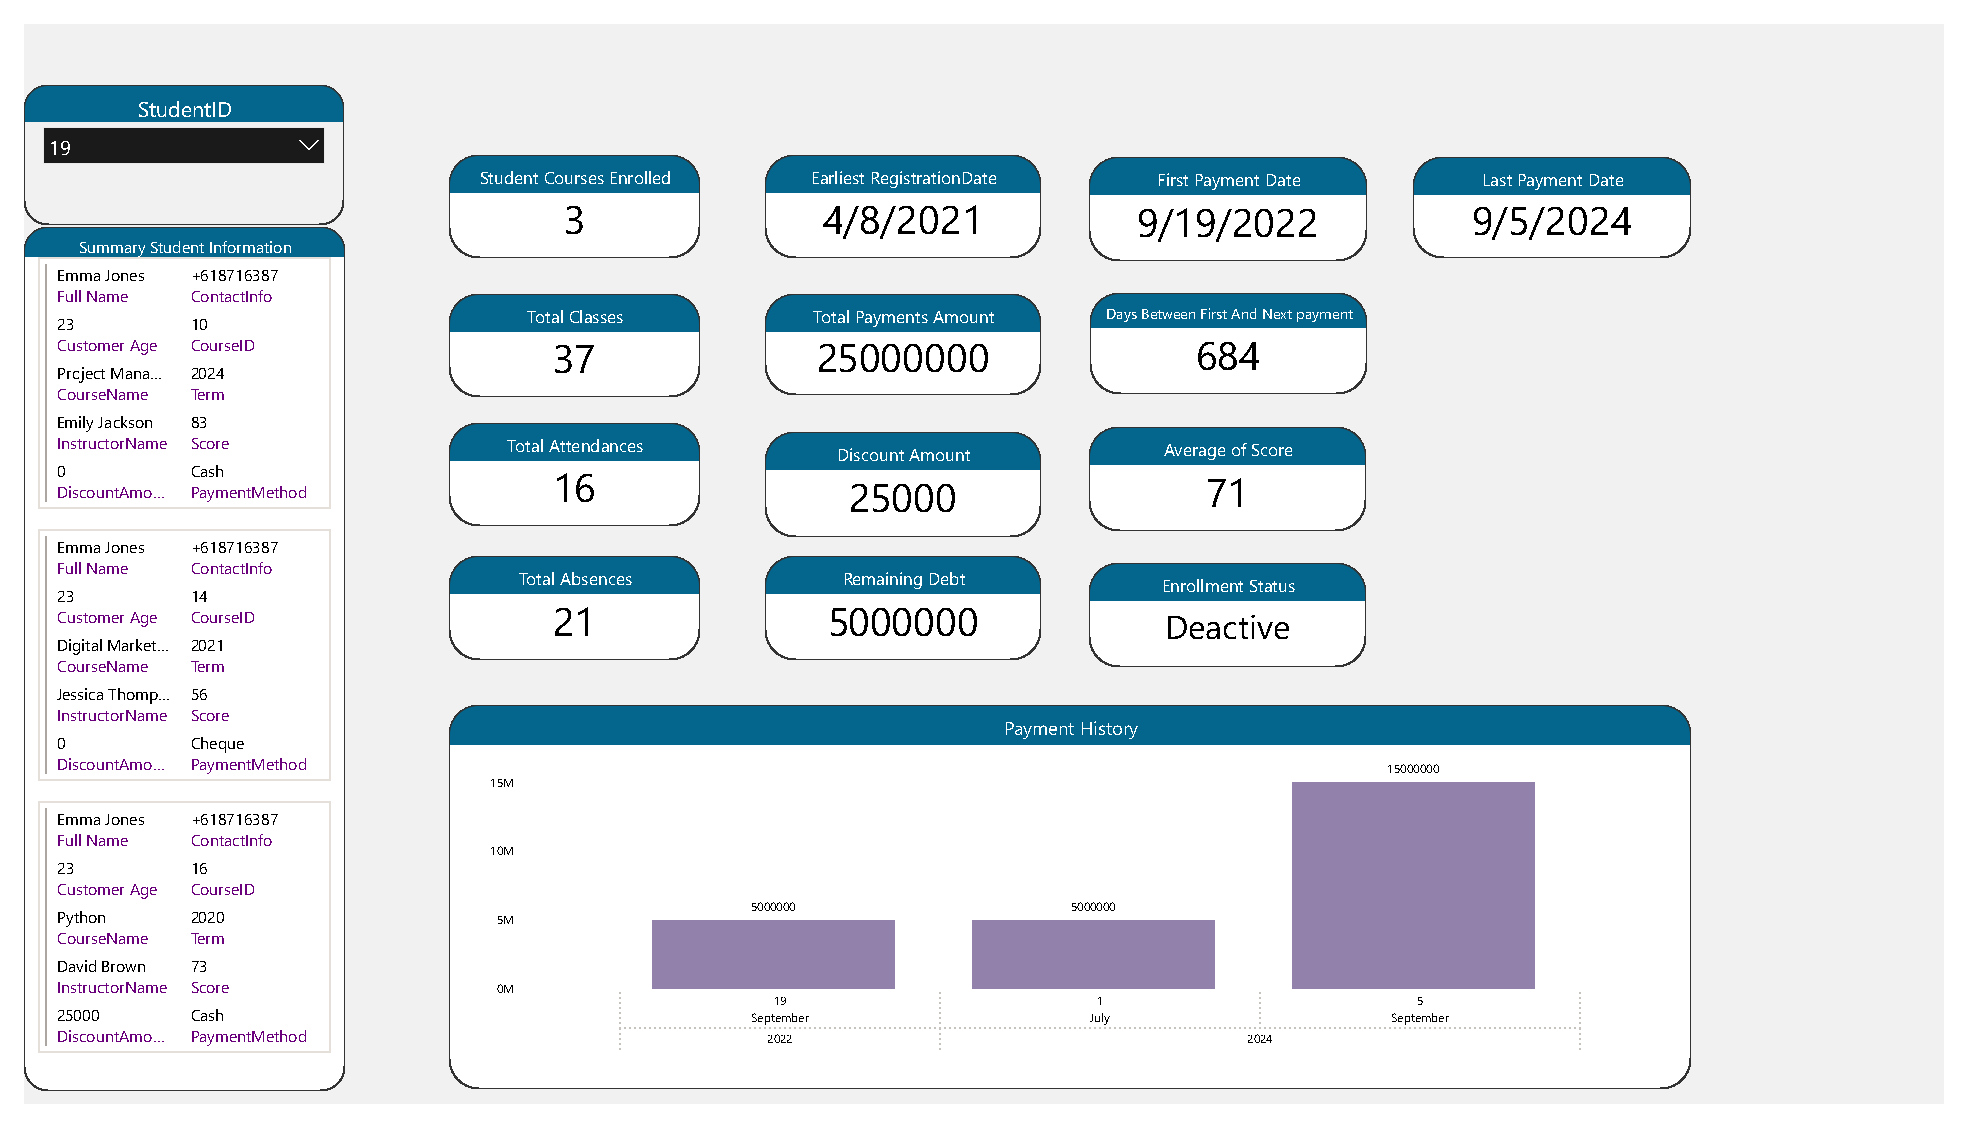
Page 10: Student Profile Summary
- Purpose: This page provides a comprehensive summary of individual student profiles, including their attendance, performance, financial status, and overall academic journey. It offers a holistic view of each student to support personalized learning and administration.
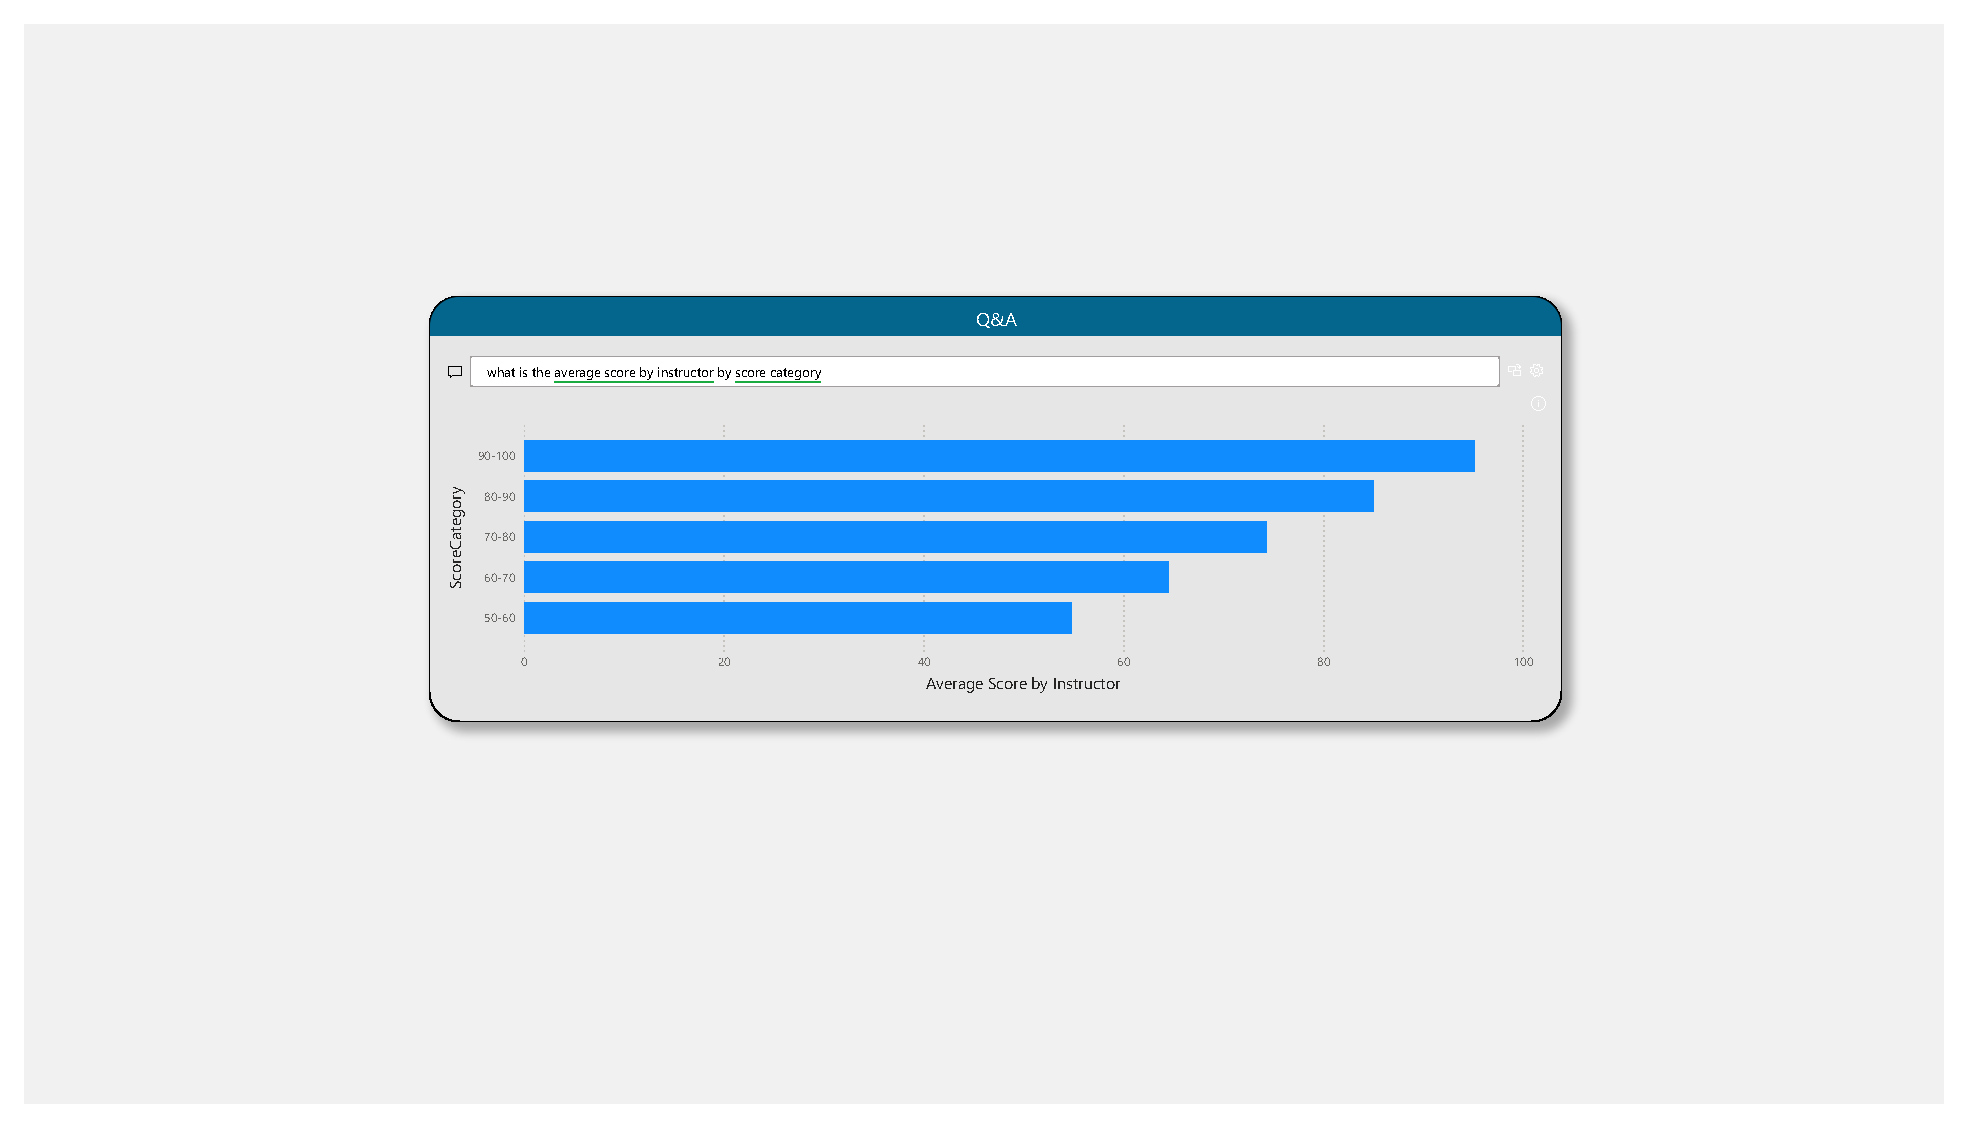
Page 11: Q&A Engine
- Purpose: This section acts as an interactive question-and-answer platform, enabling institutions to access real-time data and insights regarding student performance, instructor effectiveness, and financial health. It supports data-driven decision-making and problem-solving.
Note:Some reports in this dashboard include tooltips similar to the image below
Why Choose the Educational Institutes Analytics Dashboard?
- Data-Driven Decisions: Make well-informed decisions with access to detailed insights across all areas of your institution.
- Improved Student Outcomes: Track academic performance and implement strategies to enhance student learning and engagement.
- Financial Optimization: Analyze revenue streams, manage expenses, and maintain financial sustainability.
- Instructor Assessment: Continuously evaluate and improve the quality of teaching within the institution.
- User-Friendly Interface: Enjoy easy navigation with a visually appealing, interactive dashboard designed for all user levels.
The Educational Institutes Analytics Dashboard is the ideal tool for educational leaders looking to optimize operational efficiency, boost student satisfaction, and drive academic excellence. Take control of your institution’s data and shape the future of education with actionable insights from this comprehensive platform.

Reviews
There are no reviews yet.