In today’s fast-paced and technology-driven world, schools and educational institutions are under increasing pressure to improve student outcomes, streamline operations, and maintain financial stability. The School Data Analytics Dashboard is a powerful tool designed to help schools and institutions achieve these goals by providing real-time access to comprehensive data on students, instructors, finances, and operations.
In this in-depth guide, we will explore how a School Data Analytics Dashboard can transform the way educational institutions manage their resources, improve student success, and make data-driven decisions. We will delve into the key features, benefits, and real-world applications of this dashboard, and discuss how it can help educational leaders stay ahead in a competitive environment.
Table of Contents:
- What is a School Data Analytics Dashboard?
- Why Data-Driven Decision Making is Essential in Education
- Key Features of a School Data Analytics Dashboard
- Benefits of Using a School Data Analytics Dashboard
- How to Use School Data Analytics for Academic Performance Improvement
- Enhancing Teacher Performance with Data
- Financial Management Through School Analytics Dashboard
- Real-World Applications and Success Stories
- Implementing a School Data Analytics Dashboard: Best Practices
- Conclusion
1. What is a School Data Analytics Dashboard?
A School Data Analytics Dashboard is a comprehensive digital platform designed to compile, analyze, and display a wide range of data related to the academic, operational, and financial aspects of a school. It consolidates various metrics, such as student performance, enrollment trends, teacher evaluations, and financial health, into a single, user-friendly interface.
This dashboard allows school administrators, educators, and decision-makers to access real-time data insights and make informed decisions to improve the overall performance of their institution. By tracking and analyzing critical metrics, the dashboard empowers schools to optimize resources, enhance student outcomes, and ensure financial sustainability.
2. Why Data-Driven Decision Making is Essential in Education
The landscape of education is changing rapidly, and schools must adapt to keep up with new challenges and expectations. Data-driven decision-making is no longer a luxury but a necessity for educational institutions striving to meet the needs of their students and stakeholders.
Some key reasons why data-driven decision-making is essential in education include:
- Personalized Learning: Data allows educators to tailor learning experiences to meet the individual needs of students, helping them reach their full potential.
- Increased Accountability: Schools are accountable to students, parents, and the wider community. Data helps administrators track progress, demonstrate success, and identify areas for improvement.
- Resource Optimization: By analyzing data on class sizes, teacher performance, and student engagement, schools can allocate resources more effectively, ensuring that time, money, and personnel are used efficiently.
- Predictive Insights: Data analytics can help schools predict trends in enrollment, student success, and even dropout rates, enabling proactive measures to be implemented before problems arise.
3. Key Features of a School Data Analytics Dashboard
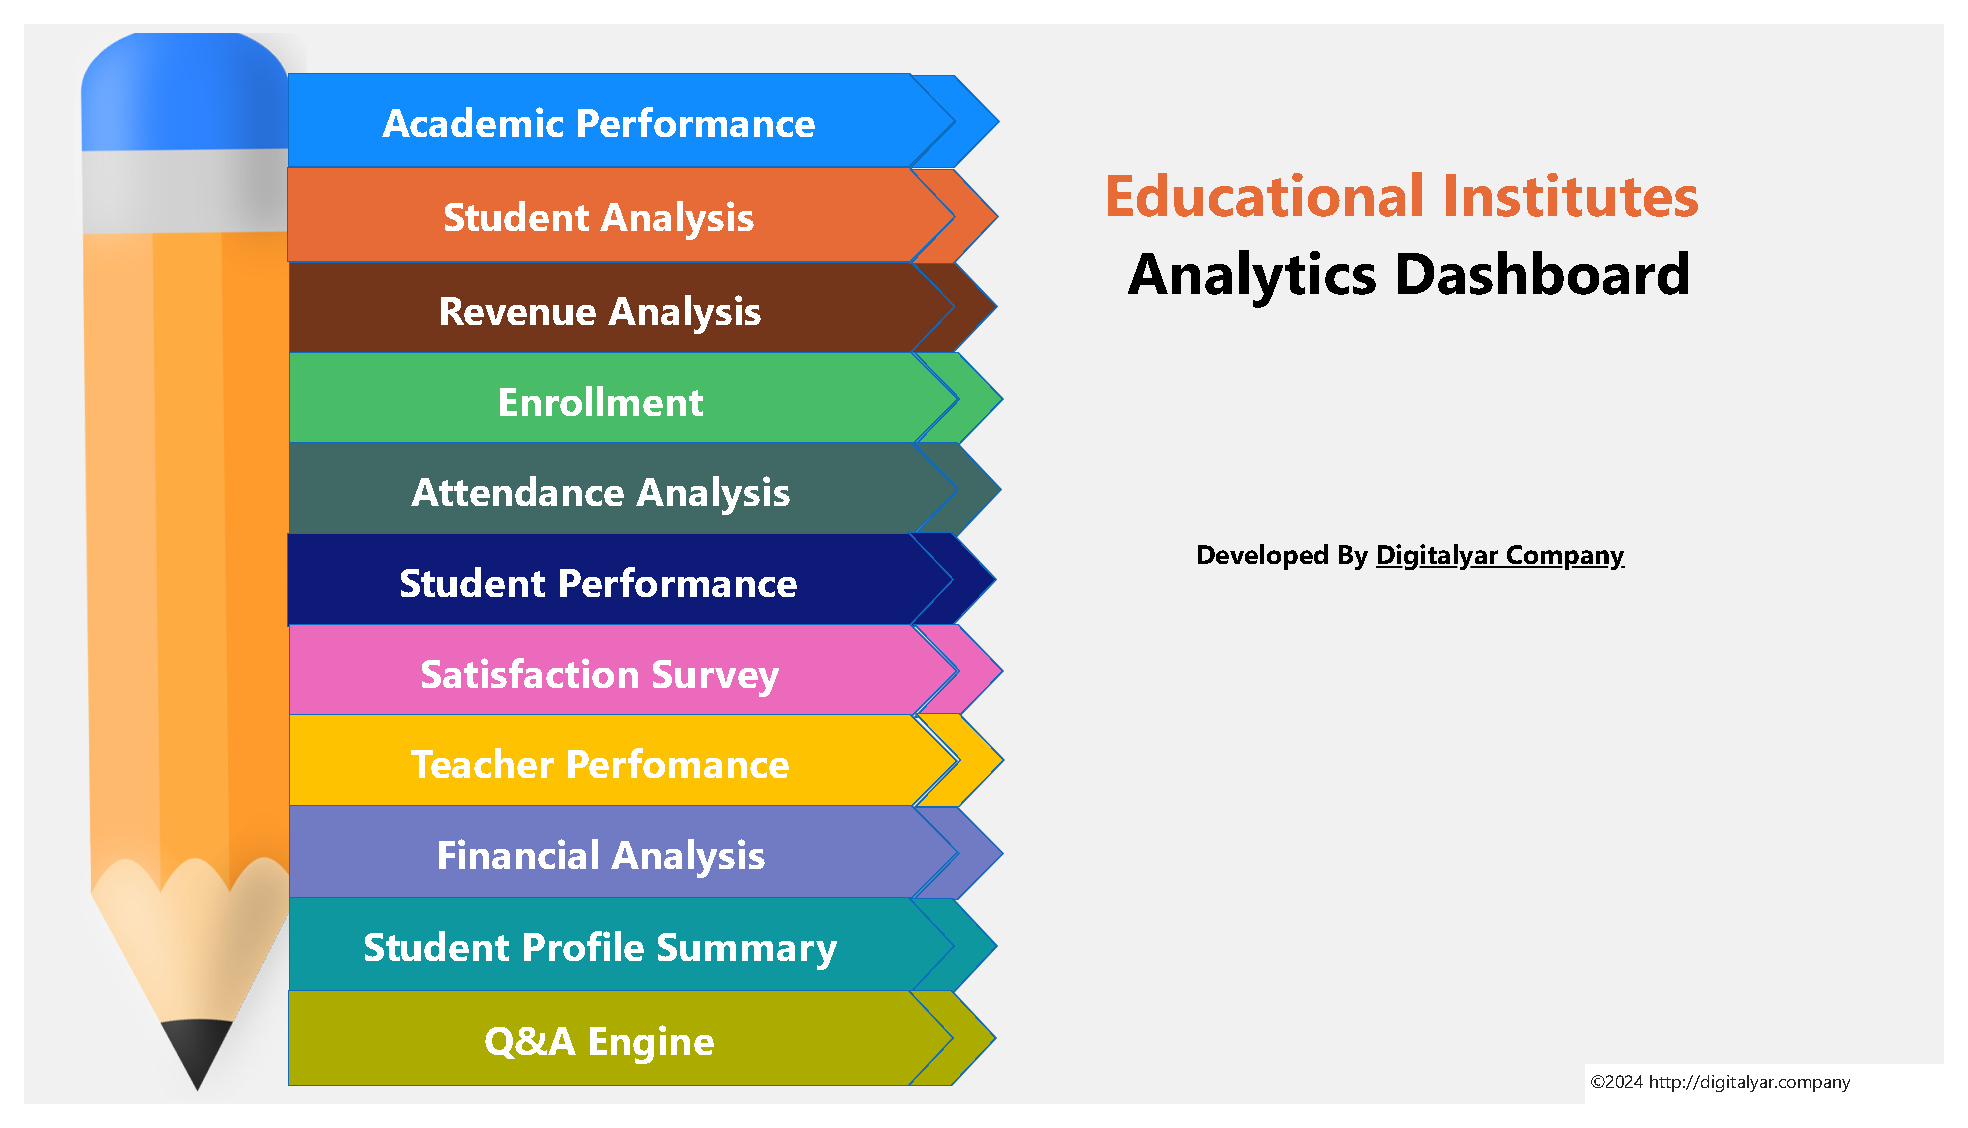
A School Data Analytics Dashboard typically includes the following key features:
a. Academic Performance Tracking
This feature enables schools to monitor the academic performance of students across various subjects and courses. With real-time access to grades, test scores, and overall academic progress, educators can identify students who may need additional support and intervene before it’s too late.
b. Student Demographic and Enrollment Analysis
This component provides valuable insights into student demographics, including age, gender, nationality, and socioeconomic status. Additionally, it tracks enrollment patterns over time, helping schools understand how their student body is evolving and allowing for better planning of resources and services.
c. Financial Health Monitoring
The dashboard offers detailed insights into the financial health of the school, including income, expenses, and revenue generated by different programs and courses. Schools can use this data to improve financial management, reduce waste, and ensure long-term sustainability.
d. Teacher Performance Evaluation
By tracking instructor performance through student feedback, pass/fail rates, and class engagement levels, the dashboard helps administrators identify top-performing teachers and those who may need professional development. This feature fosters a culture of continuous improvement and accountability.
e. Attendance Tracking
Student attendance is a critical factor in academic success. The dashboard provides detailed attendance reports, helping schools identify students with frequent absences and develop strategies to improve engagement and reduce absenteeism.
f. Satisfaction Surveys and Feedback
This feature collects and analyzes student and parent feedback through surveys. Schools can use this data to assess overall satisfaction with programs, teachers, and facilities, and implement changes that enhance the student experience.
g. Real-Time Data Access
Perhaps one of the most important features, real-time data access allows educators and administrators to make decisions based on the latest available information, ensuring that actions are timely and effective.
4. Benefits of Using a School Data Analytics Dashboard
Implementing a School Data Analytics Dashboard offers numerous benefits that can significantly improve both the academic and operational performance of a school. Here are some key advantages:
a. Improved Student Outcomes
By providing real-time data on student performance, the dashboard enables educators to identify struggling students early and offer targeted interventions. This proactive approach helps improve academic achievement and reduces the risk of dropouts.
b. Better Resource Allocation
With detailed insights into class sizes, teacher workload, and student engagement, schools can allocate resources more efficiently. For example, schools can balance class sizes to ensure that teachers are not overwhelmed and that students receive adequate attention.
c. Enhanced Teacher Development
Teacher performance data allows school administrators to provide targeted professional development to instructors, helping them improve their teaching methods and better engage students.
d. Financial Accountability
By tracking financial data such as expenses, revenue, and budgets, the dashboard helps schools manage their finances more effectively. This leads to better financial planning, reduced waste, and improved long-term sustainability.
e. Increased Stakeholder Engagement
Data-driven insights can be shared with stakeholders, including parents, teachers, and school boards, to demonstrate the school’s performance and accountability. This transparency fosters trust and encourages collaborative efforts to improve the institution.
5. How to Use School Data Analytics for Academic Performance Improvement
Academic performance is one of the most critical aspects of any educational institution. With a School Data Analytics Dashboard, schools can monitor student grades, test scores, and overall academic progress in real-time. Here’s how this data can be used to improve academic outcomes:
a. Identify At-Risk Students
By tracking student performance data, schools can identify at-risk students who may be falling behind. Early intervention programs, such as tutoring or personalized learning plans, can then be implemented to help these students catch up and succeed.
b. Analyze Trends Over Time
The dashboard allows schools to track academic performance trends over multiple years, enabling them to see if interventions or curriculum changes are making a difference.
c. Adjust Curriculum and Teaching Methods
Data on student performance can help schools adjust their curriculum and teaching methods to better meet the needs of their students. For example, if students consistently perform poorly in a particular subject, it may indicate a need to revise the curriculum or offer additional teacher training.
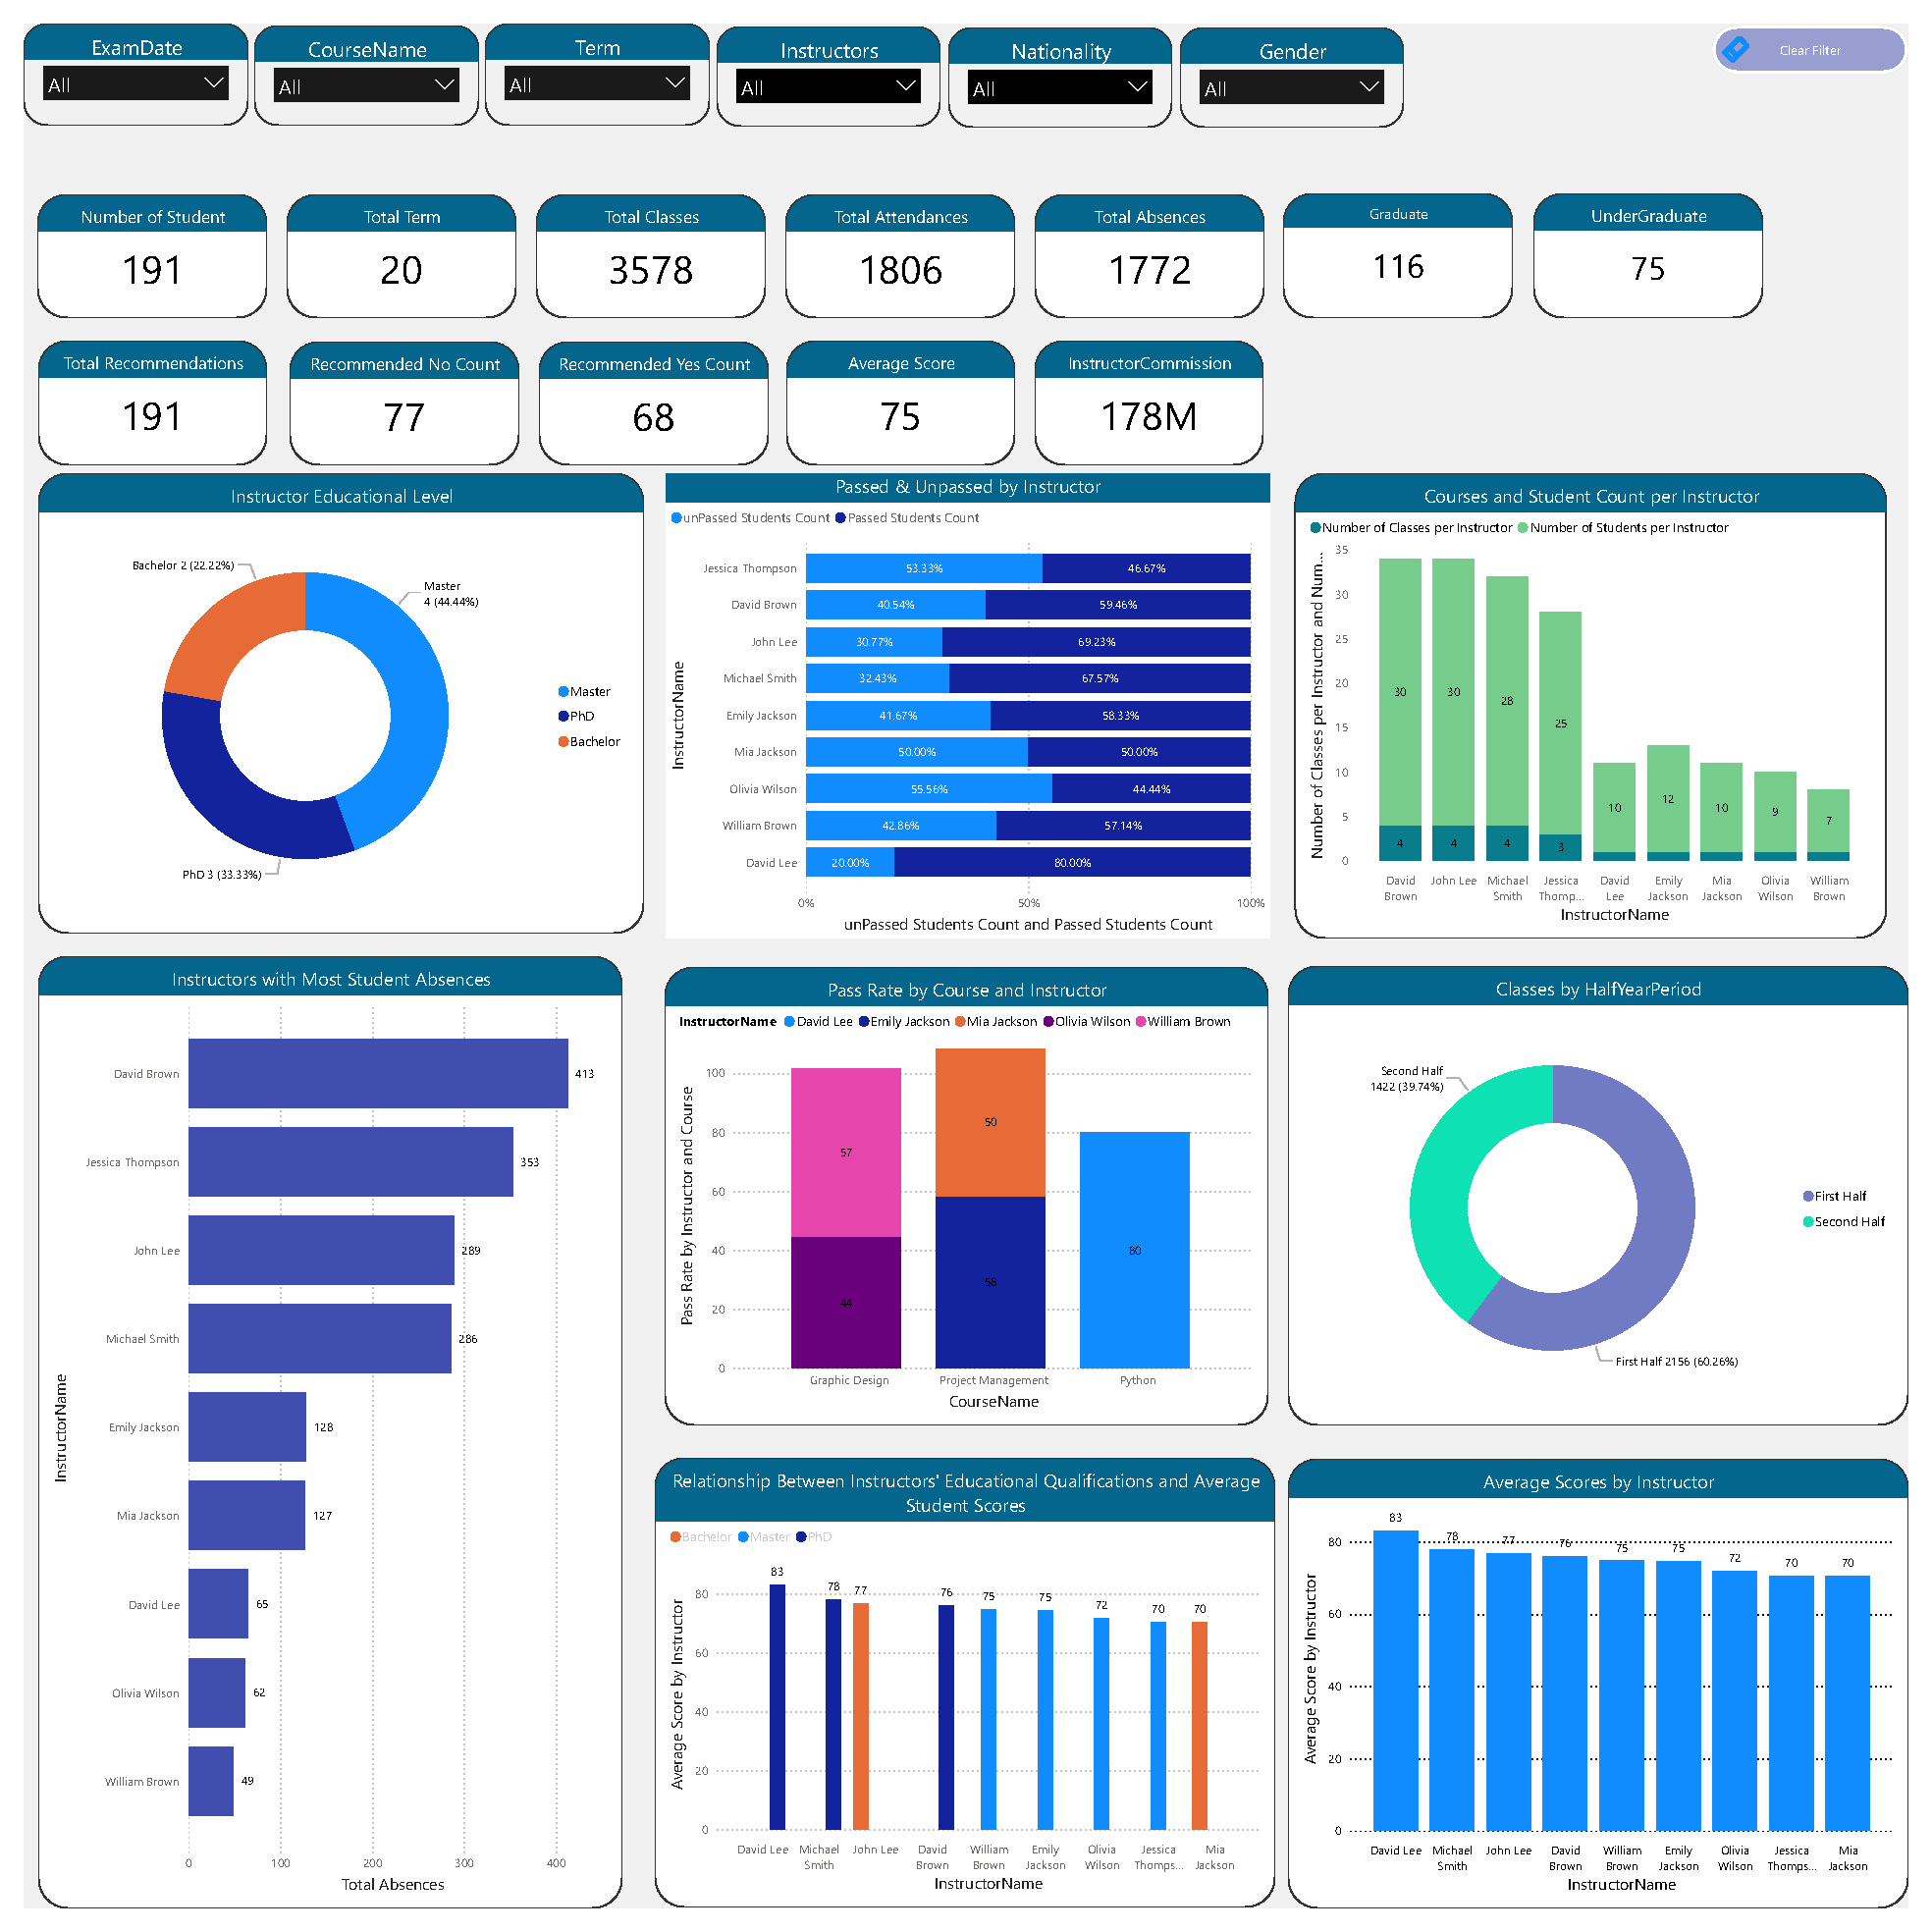
6. Enhancing Teacher Performance with Data
A key feature of the School Data Analytics Dashboard is the ability to track teacher performance through a variety of metrics, including student feedback, class engagement, and pass/fail rates. Here’s how schools can use this data to enhance teaching quality:
a. Continuous Feedback
By regularly collecting student feedback on instructor performance, schools can provide teachers with continuous, real-time data on how they are doing. This allows for ongoing improvements rather than waiting for end-of-term evaluations.
b. Professional Development
Teacher performance data can be used to identify areas where professional development may be needed. For example, if certain teachers consistently receive lower student engagement scores, they may benefit from workshops or mentoring to improve their classroom management skills.
c. Recognize High Performers
Data can also be used to recognize and reward high-performing teachers, fostering a culture of excellence and motivating instructors to continually strive for improvement.
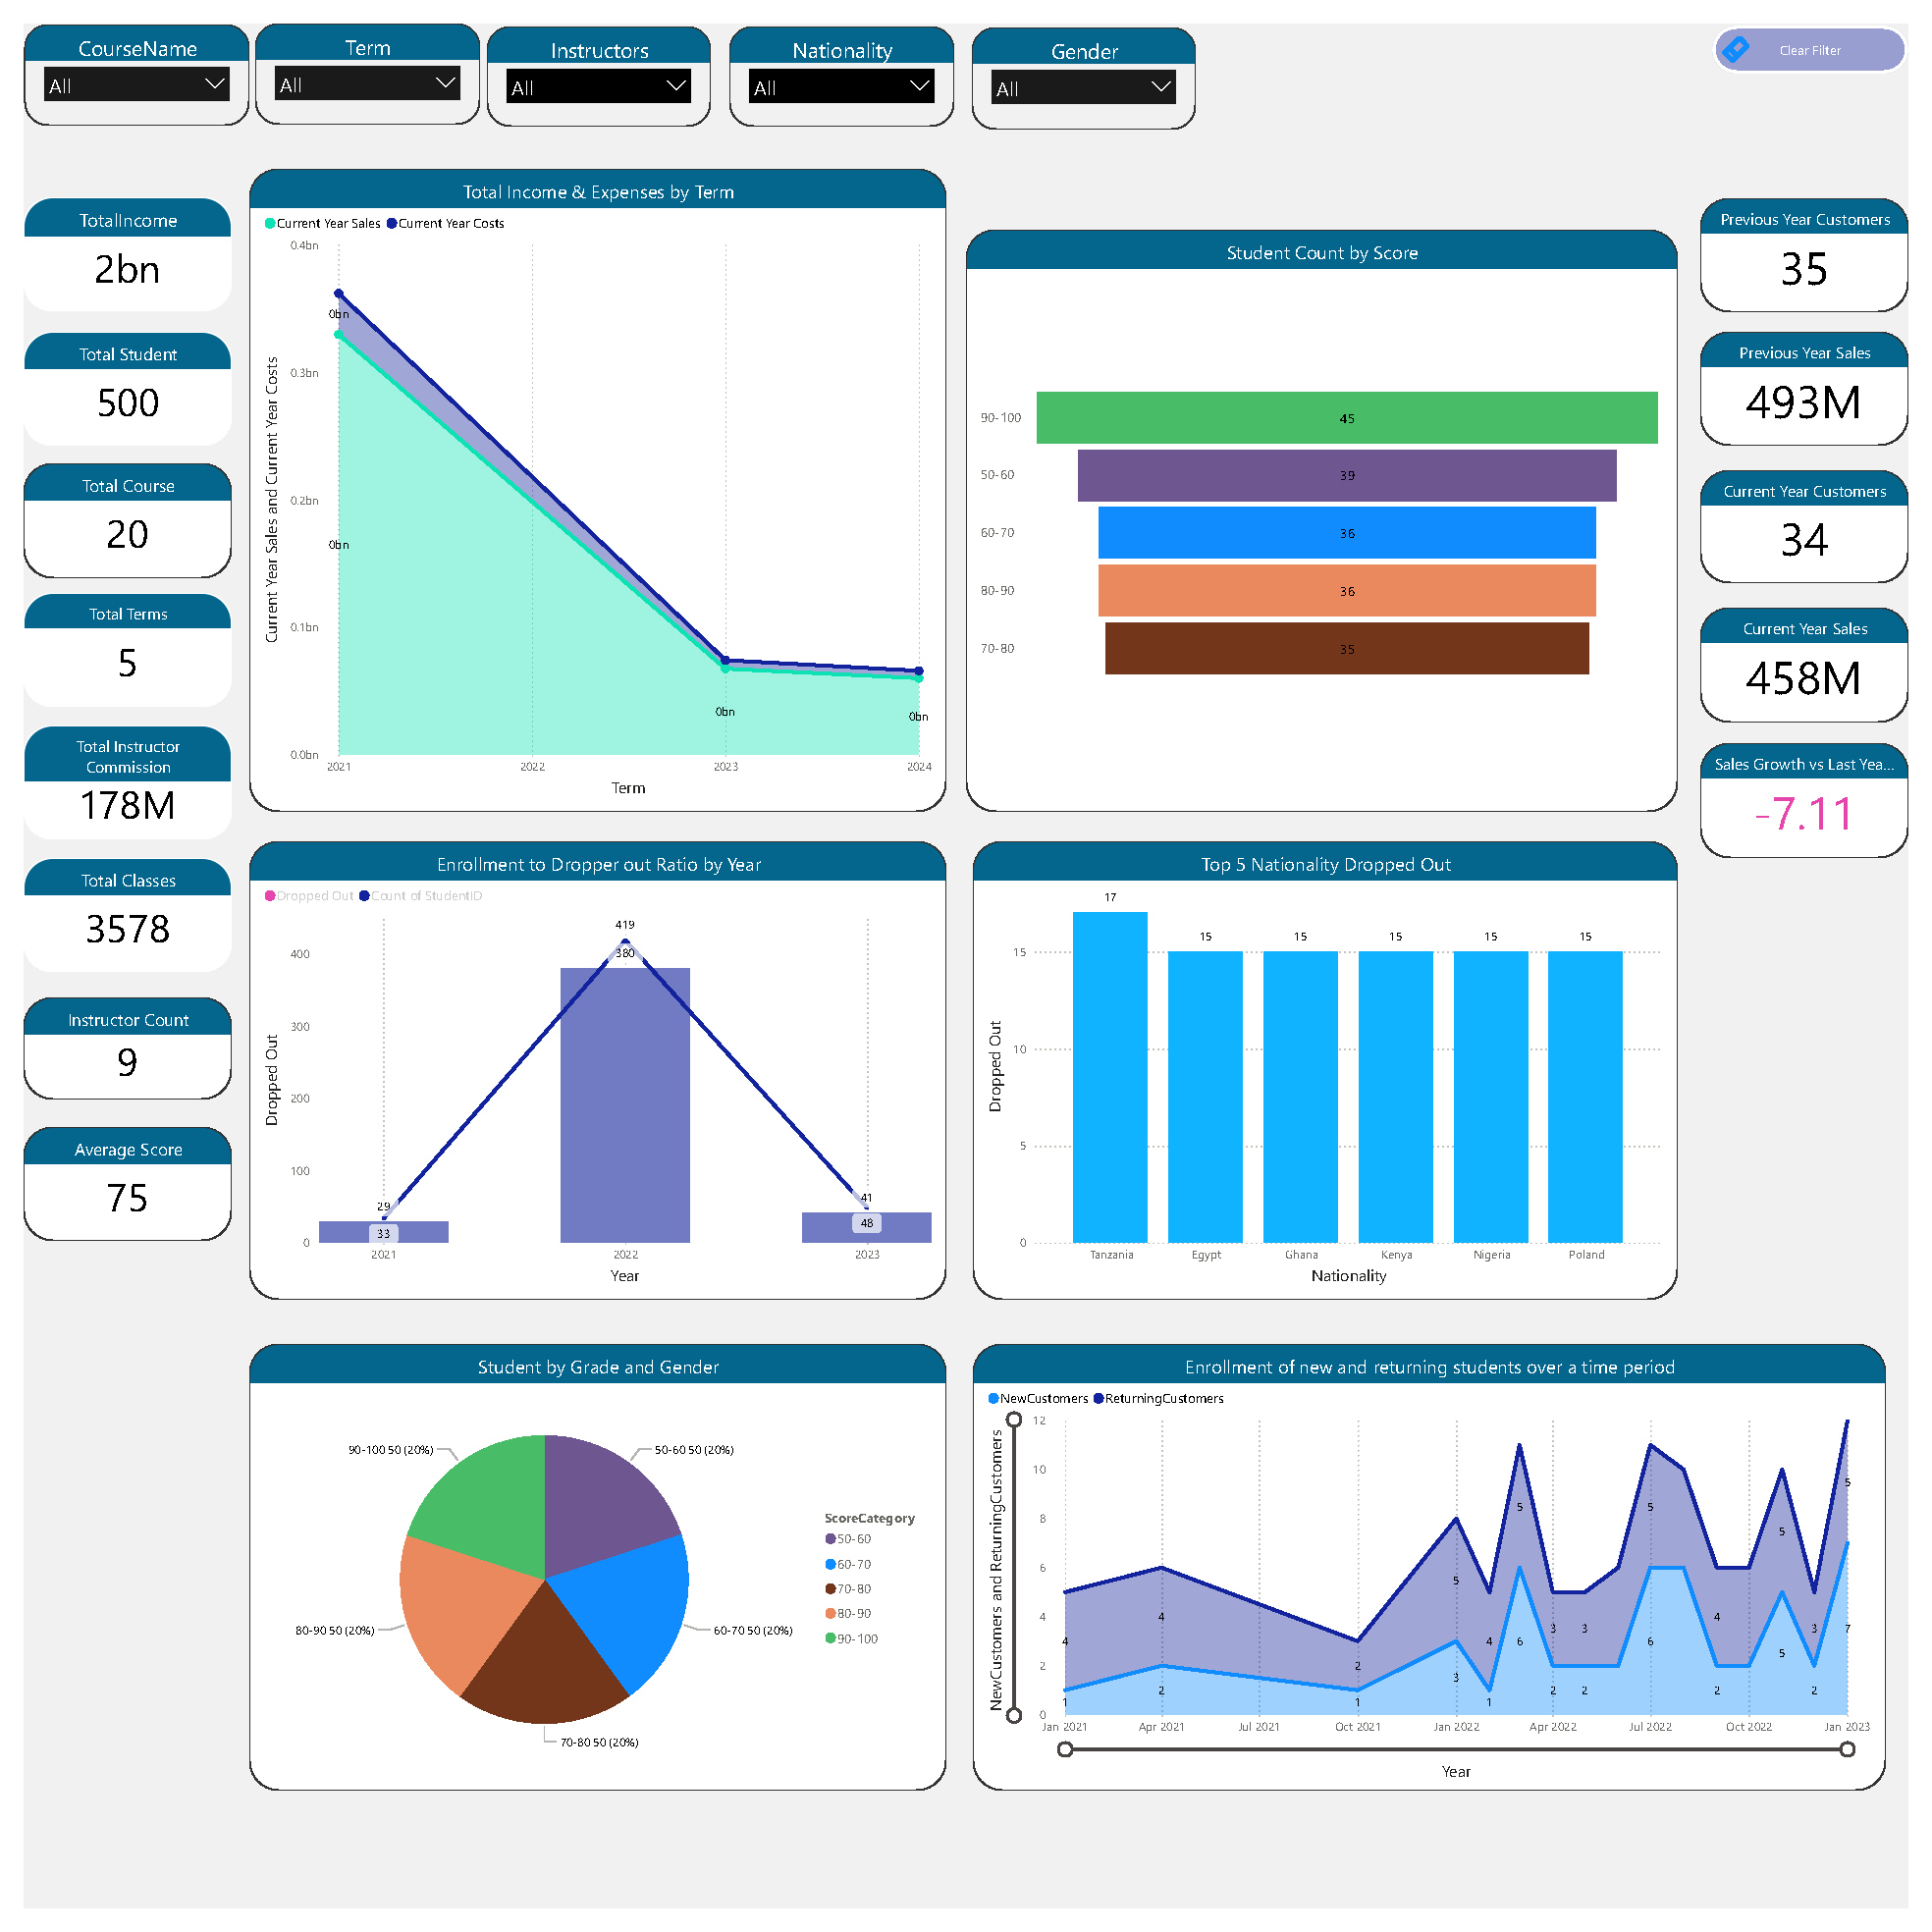
7. Financial Management Through School Analytics Dashboard
Effective financial management is essential for the long-term sustainability of any school. A School Data Analytics Dashboard provides valuable insights into the financial health of the institution, including:
- Revenue vs. Expenses: Schools can track how much revenue each program or course generates and compare it to the associated costs, allowing for more informed budgeting decisions.
- Student Debts and Payment Histories: The dashboard can monitor student debts and payment histories, helping schools manage cash flow and address financial issues proactively.
- Resource Allocation: By analyzing financial data, schools can ensure that resources are allocated efficiently, reducing waste and improving the return on investment for educational programs.
8. Real-World Applications and Success Stories
Schools and educational institutions around the world are already reaping the benefits of implementing a School Data Analytics Dashboard. Here are a few success stories:
a. Improved Retention Rates
A large international school implemented a data analytics dashboard to track student performance and attendance. By identifying at-risk students early and offering personalized support, the school saw a 15% improvement in student retention rates over two years.
b. Increased Teacher Engagement
A mid-sized school district used data from their analytics dashboard to evaluate teacher performance and provide targeted professional development. As a result, student engagement increased by 10%, and teacher satisfaction improved significantly.
c. Enhanced Financial Planning
A private school in the U.S. used their analytics dashboard to monitor expenses and revenue for each program. By identifying underperforming programs and reallocating resources, the school improved its financial stability and increased its overall profitability by 20%.
9. Implementing a School Data Analytics Dashboard: Best Practices
To get the most out of a School Data Analytics Dashboard, schools should follow these best practices:
a. Start with Clear Goals
Before implementing a dashboard, define clear goals for what you want to achieve. Are you looking to improve student outcomes, reduce absenteeism, or better manage your finances? Having clear objectives will help you get the most value from the data.
b. Ensure Data Accuracy
A dashboard is only as good as the data it collects. Make sure that all data inputs are accurate, timely, and complete to ensure the insights you derive are reliable.
c. Train Your Team
Make sure that administrators, teachers, and staff understand how to use the dashboard and interpret the data. Offer training sessions to ensure that everyone is comfortable using the platform.
d. Use Data for Continuous Improvement
The power of a School Data Analytics Dashboard lies in its ability to provide real-time insights. Use this data to continuously monitor performance and make adjustments as needed to improve student outcomes, teacher engagement, and financial health.
10. Conclusion
A School Data Analytics Dashboard is a game-changer for educational institutions looking to improve their operational efficiency, enhance student outcomes, and maintain financial sustainability. By providing real-time access to critical data, this dashboard empowers educators and administrators to make informed decisions that positively impact the future of the school and its students.
Whether you’re looking to boost student engagement, optimize resource allocation, or improve the quality of teaching, a School Data Analytics Dashboard is the ultimate tool for success in today’s competitive educational landscape. Start your journey towards data-driven excellence today!


No comment