Sale!

Hotel Performance Dashboard in Power BI

Original price was: $300.00.Current price is: $250.00.

A Hotel Performance Dashboard is a visual tool that allows hotel managers, owners, or analysts to monitor and track key performance indicators (KPIs) related to the hotel’s operations. It provides insights into various metrics such as occupancy rates, revenue, guest satisfaction, and other operational data in real-time. The goal is to offer a comprehensive view of the hotel’s performance to make informed decisions for improvement and growth.

The Hotel Performance Dashboard offers a robust and interactive platform that delivers profound insights into hotel and guest accommodation operations. It arms hotel managers and stakeholders with up-to-the-minute data, facilitating the tracking of essential performance indicators (KPIs) spanning reservations, guest profiles, income, and operational effectiveness. With its ability to present vital statistics via clear visual representations, this dashboard is instrumental in enhancing guest experiences, refining processes, and increasing financial returns.

This dashboard is designed using the Power BI Desktop software but is fully compatible for use with the server version of the software as well.

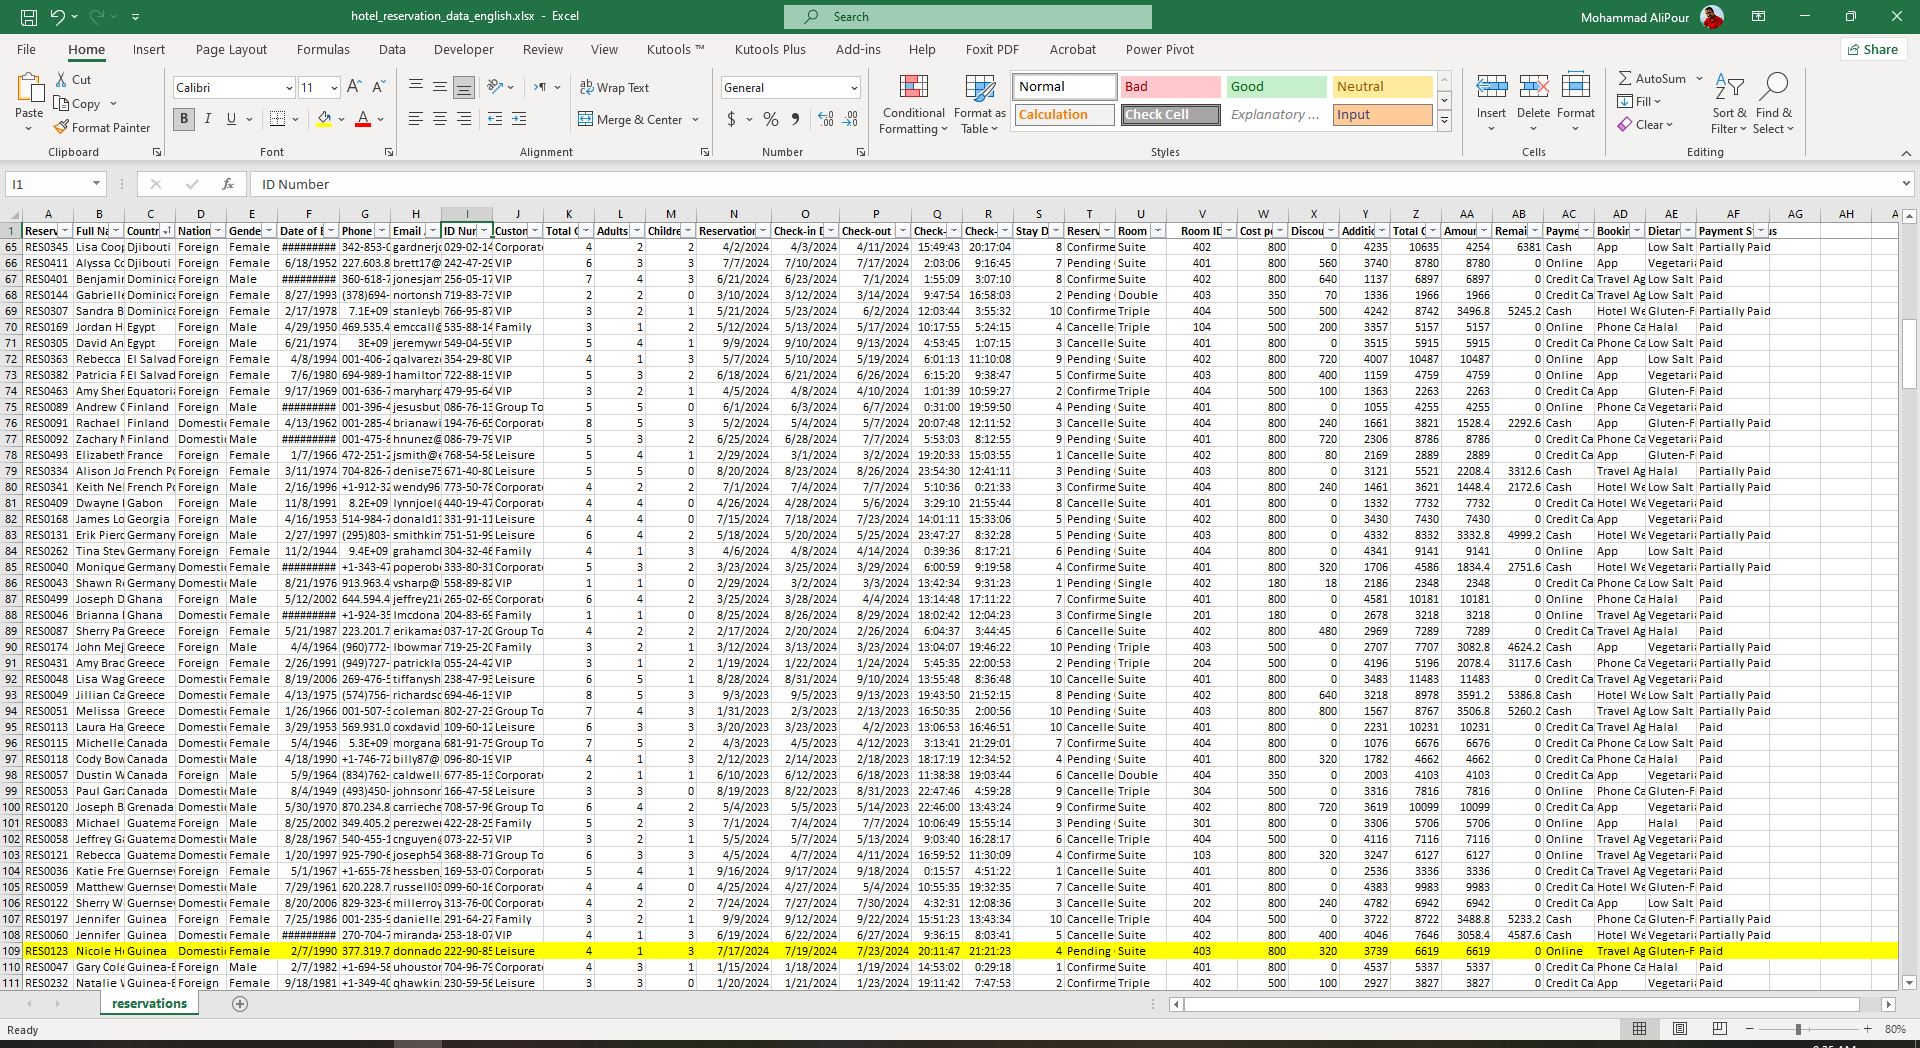
Below is a summary of the fields used in the dashboard, along with a brief description of each:

Field Description
Reservation ID Unique identifier for each reservation, used for tracking.
Full Name Full name of the guest who made the reservation.
Country Guest’s country of residence.
Nationality Guest’s nationality, which might differ from their country of residence.
Gender Gender of the guest (male or female).
Date of Birth Guest’s birthdate, used to assess age and offer specific services.
Phone Number Contact number of the guest for communication and follow-up.
Email Address Guest’s email address for sending confirmations and reservation-related communication.
ID Number Guest’s passport or ID number for identity verification.
Customer Type Type of customer (e.g., Regular, VIP, Business, Family, Leisure).
Total Guests Total number of guests included in the reservation.
Adults Number of adults included in the reservation.
Children Number of children included in the reservation.
Reservation Date Date when the reservation was made.
Check-in Date Guest’s check-in date at the hotel.
Check-out Date Guest’s check-out date from the hotel.
Check-in Time Exact time of guest’s check-in at the hotel.
Check-out Time Exact time of guest’s check-out from the hotel.
Stay Duration Duration of the guest’s stay (in days).
Reservation Status Status of the reservation (e.g., confirmed, canceled, pending, no-show).
Room Type Type of room booked (e.g., Single, Double, Suite).
Room ID Room number assigned to the guest.
Cost per Night Cost per night of the booked room.
Discount Any discounts applied to the reservation, if applicable.
Total Cost Total cost of the stay after applying discounts.
Amount Paid Amount paid by the guest.
Remaining Amount Outstanding amount still to be paid by the guest.
Payment Method Method of payment (e.g., Cash, Credit Card, Bank Transfer).
Payment Status Status of payment (e.g., Paid, Pending, Prepaid, Refunded).
Booking Method Method of booking (e.g., Online, Phone, In-Person, Travel Agency).
Additional Services Cost Cost of additional services such as room service, parking, massage, etc.
Dietary Preferences Guest’s dietary preferences (e.g., Vegetarian, Gluten-Free, etc.).
note: Your Excel file must exactly match the structure of our file in order to load the dashboard without errors.

Hotel Performance Dashboard Reports Overview

Page 1:

Total Reservations by Month:
Displays the total number of reservations made each month, helping you analyze reservation trends over time.
Total Guests by Month:
Shows the total number of guests per month, allowing you to track changes in guest numbers throughout the year.
Total Canceled Reservations by Month:
Displays the number of canceled reservations each month, helping identify cancellation patterns.
Total Confirmed Reservations by Month:
Shows confirmed reservations per month, helping evaluate reception performance.
Average Stay Duration by Month:
Calculates and displays the average guest stay duration for each month, helping analyze stay patterns.
Total Revenue by Month:
Displays total hotel revenue by month, assisting in financial performance evaluation.
Top 5 Countries with Most Reservations:
Shows the countries with the highest number of reservations, helping identify target markets.

Hotel-Reservations-DashBoard

Top 5 Countries with Fewest Reservations:
Displays countries with the fewest reservations, helping identify growth opportunities.
Guest Breakdown by Booking Method:
Shows reservation methods (online, phone, etc.), helping improve marketing strategies.
Importance of Distribution Channels by Annual Guest Numbers:
Displays the impact of each distribution channel on annual guest numbers, helping optimize marketing efforts.
New Customers This Year:
Shows the number of new customers in the current year, helping assess customer acquisition strategies.
Returning Customers This Year:
Shows the number of returning customers this year, helping analyze customer loyalty.
Revenue from New Customers This Year:
Displays revenue generated from new customers this year, helping assess the financial impact of new customer acquisitions.
Revenue from Returning Customers This Year:
Displays revenue from returning customers this year, helping analyze the financial impact of loyal customers.
Total Reservations Last Year:
Shows total reservations from the previous year, enabling performance comparisons between current and past years.
Total Revenue Last Year:
Displays total hotel revenue from the previous year, helping evaluate past financial performance.
New Customers This Month:
Shows the number of new customers in the current month, helping assess current acquisition efforts.
Returning Customers This Month:
Displays the number of returning customers this month, helping assess customer loyalty.
Revenue from New Customers This Month:
Shows revenue from new customers in the current month, helping evaluate the financial impact of recent acquisitions.
Revenue from Returning Customers This Month:
Displays revenue from returning customers in the current month, helping assess the impact of loyal customers.
Revenue from Last Month:
Shows total hotel revenue from the previous month, helping compare financial performance.
Total Revenue This Year:
Displays total hotel revenue for the current year, assisting in revenue trend analysis.
Total Revenue This Month:
Displays total revenue for the current month, helping evaluate financial performance.
Revenue for the Same Month Last Year:
Shows revenue for the same month in the previous year, helping compare financial performance.
Revenue Growth vs. Last Year’s Same Month:
Displays the percentage change in revenue compared to the same month last year, helping assess financial growth.
Revenue Growth Rate vs. Last Year:
Displays the revenue growth rate compared to the previous year, assisting in evaluating financial performance.

Page 2:

Total Guests by Reservation Date, Country, Nationality, Gender, and Reservation Status:
Displays total guests based on various filters, helping in detailed data analysis.
Total Canceled Reservations by Filters:
Shows the number of canceled reservations using different filters, helping identify cancellation reasons.
Total Confirmed Reservations by Filters:
Displays confirmed reservations based on various filters, helping evaluate the reception process.
Average Stay Duration by Filters:
Shows the average guest stay duration with various filters, assisting in stay pattern analysis.
Average Daily Revenue by Filters:
Displays average daily revenue based on different filters, helping evaluate financial performance.
Conversion Rate of Confirmed Reservations by Filters:
Shows the conversion rate of confirmed bookings using different filters, helping assess reception efficiency.
Comparison of Monthly Guests and Revenue (Current vs. Previous Year):
Compares guest numbers and revenue between the current and previous year using different filters.
Guest Booking Method by Channel and Filters:
Displays booking methods used by guests, helping optimize marketing strategies.
Achieved vs. Unrealized Revenue by Filters:
Shows actual and lost (canceled) revenue based on various filters, helping assess financial performance.
Revenue by Room Type and Filters:
Displays revenue generated by different room types using filters, helping identify popular room types.

Page 3:

Today’s Reservations by Filters:
Displays the number of reservations made today, helping track daily activity.
Today’s Canceled Reservations by Filters:
Shows the number of reservations canceled today, helping analyze cancellation reasons.
Today’s Confirmed Reservations by Filters:
Displays confirmed reservations for today, helping track current status.
Today’s Pending Reservations by Filters:
Shows reservations pending confirmation for today, helping manage the booking process.
Today’s Revenue by Filters:
Displays today’s revenue based on different filters, helping track daily financial performance.
Guests by Age Group and Filters:
Shows guest distribution by age group using filters, helping target market analysis.
Top 10 Customers by Revenue:
Displays the top 10 customers based on revenue, helping identify key customers.
Daily Revenue by Filters:
Shows daily revenue based on filters, helping evaluate financial performance.
Reservation Status by Country of Origin:
Displays reservation status by guest origin, helping market analysis.
Reservation Distribution on Map:
Visualizes the geographic distribution of reservations, helping identify popular areas.

Page 4:

List of Guests with Discounts and Debts by Filters:
Shows guests who received discounts but still owe payments, helping manage financial follow-ups.
Room Occupancy Rate by Type and Filters:
Displays room occupancy rates by type using filters, helping optimize capacity management.
Cancellation Trends by Season and Filters:
Shows reservation cancellation trends across seasons using filters, helping identify cancellation patterns.

Page 5:

Reservation Status Comparison with Daily Total by Filters:
Compares reservation status with total daily bookings using filters, helping assess reception performance.
Guest Dietary Preferences by Filters:
Displays guests’ dietary preferences, helping improve menu options based on guest needs.
Multiple Bookings by Customers and Filters:
Shows customers with multiple bookings using filters, helping identify loyal customers.
Revenue Flow Analysis Tree by Filters:
Visualizes hotel revenue streams using filters, helping identify income sources.

Page 6:

Peak Days of the Week by Filters:
Identifies busy days of the week using filters, helping plan staffing and services.
New Guests by Category and Filters:
Shows new guests by category using filters, helping analyze customer acquisition trends.
Comparison of Revenue from New vs. Returning Guests by Season and Filters:
Compares revenue from new and returning guests by season, helping analyze customer loyalty’s impact on revenue.
First vs. Second Half of the Year Revenue Comparison by Filters:
Compares revenue between the first and second half of the year, helping identify high and low-income periods.
Reservation Details by Filters:
Displays guest reservation details using filters, helping with in-depth data analysis.

Page 7:

Last-Minute Reservations by Day of the Week and Filters:
Shows last-minute reservations by weekday, helping identify booking behavior trends.
Long Stays vs. Short Stays Analysis by Filters:
Compares long and short stays using filters, helping analyze guest behavior.
Average Guest Costs by Nationality and Filters:
Shows average guest costs by nationality, helping analyze market potential.
Guest Age Analysis by Month and Filters:
Displays the number of adult and child guests by month, helping identify guest needs.
Room Reservations by Type and Filters:
Shows the number of room reservations by type, helping manage room capacity.
Seasonal Revenue Comparison by Filters:
Compares revenue across different seasons, helping assess financial performance.

Page 8:

Guest Reservation Summary:
Provides a comprehensive summary of guest reservations, helping you monitor each guest’s status.


Page 9:
Smart Q&A: A Natural Language Processing (NLP)-powered tool that allows you to interact with the dashboard using everyday language. Simply ask questions to quickly access the information you need.

Note:Some reports in this dashboard include tooltips similar to the image below

Hotel Performance Dashboard Key Features:

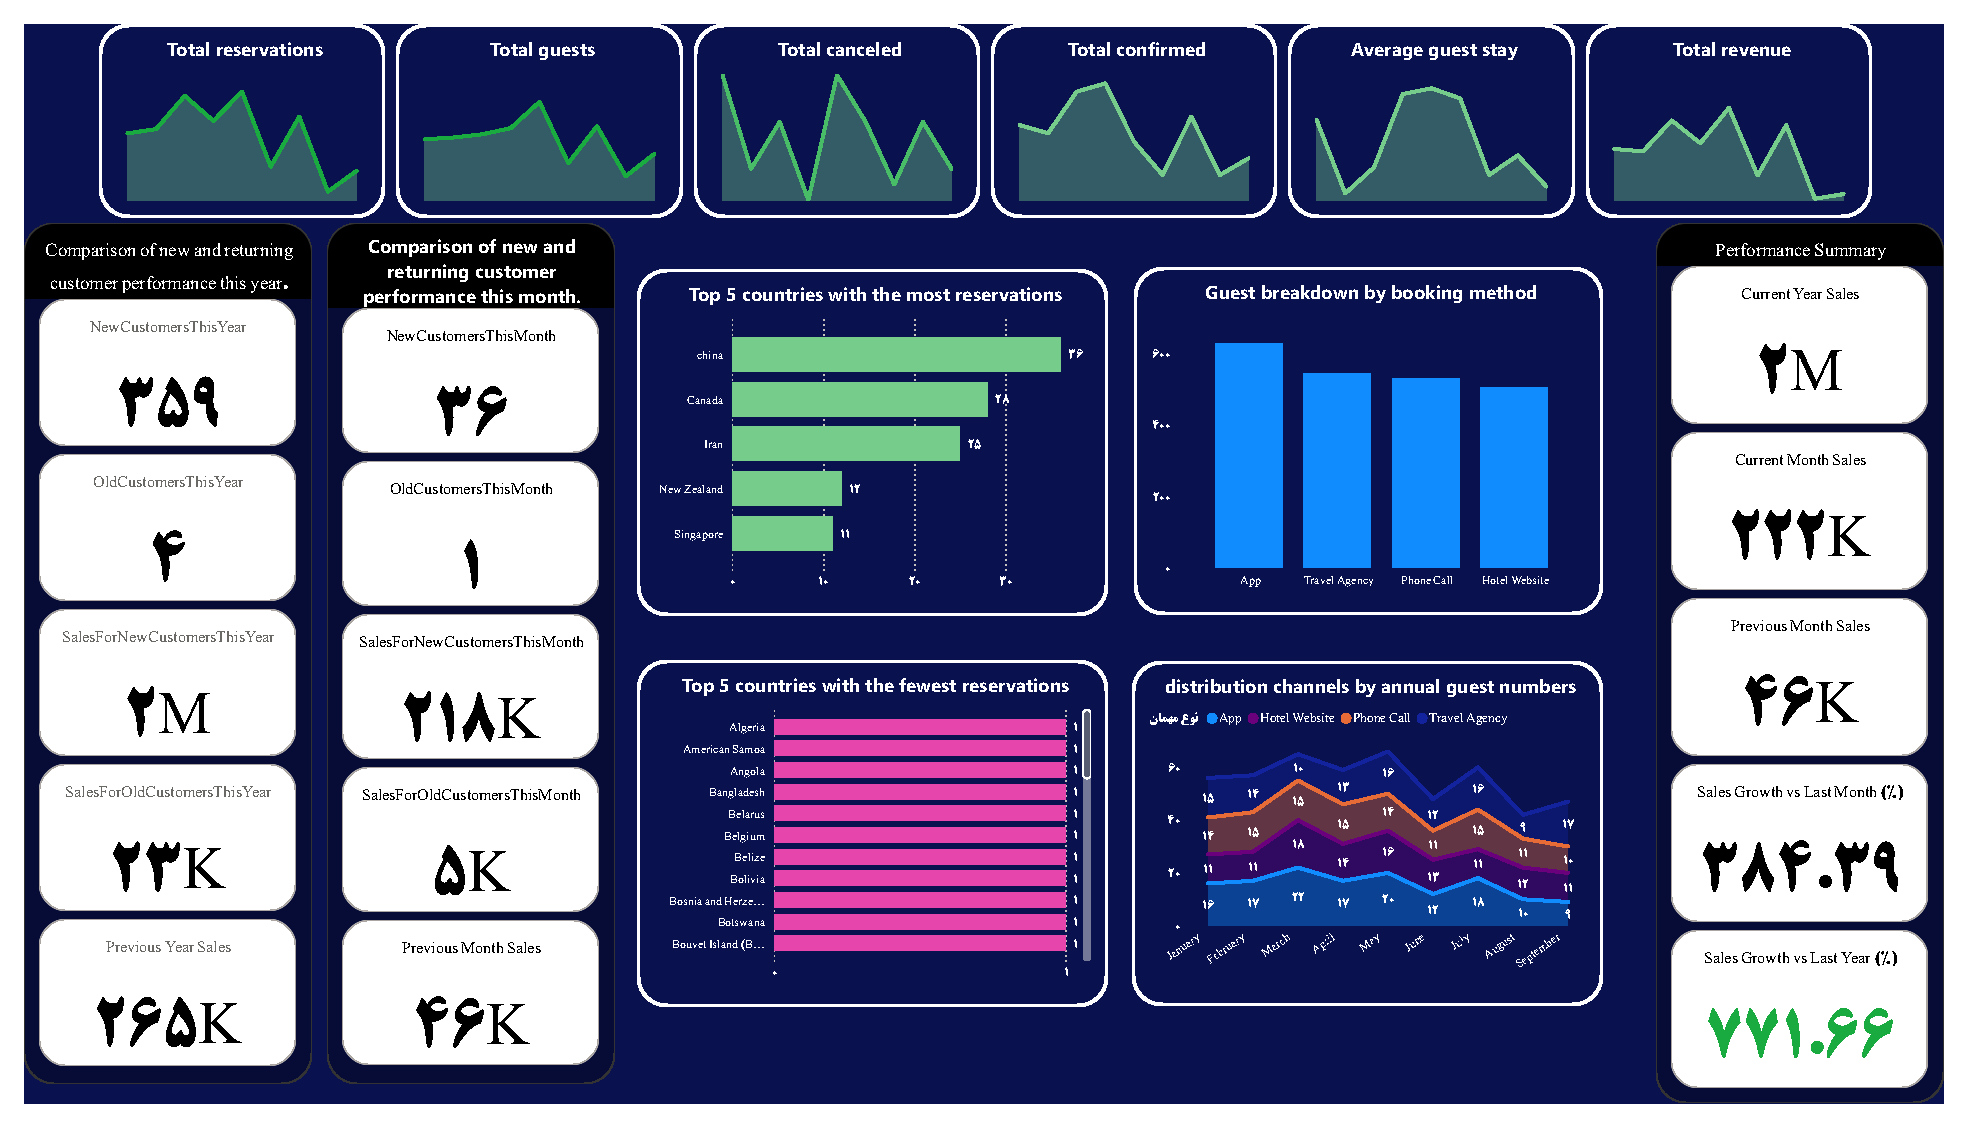
  1. Reservation and Guest Insights:
    • Total Reservations by Month: View and track the total number of reservations on a monthly basis to identify trends and seasonal fluctuations.
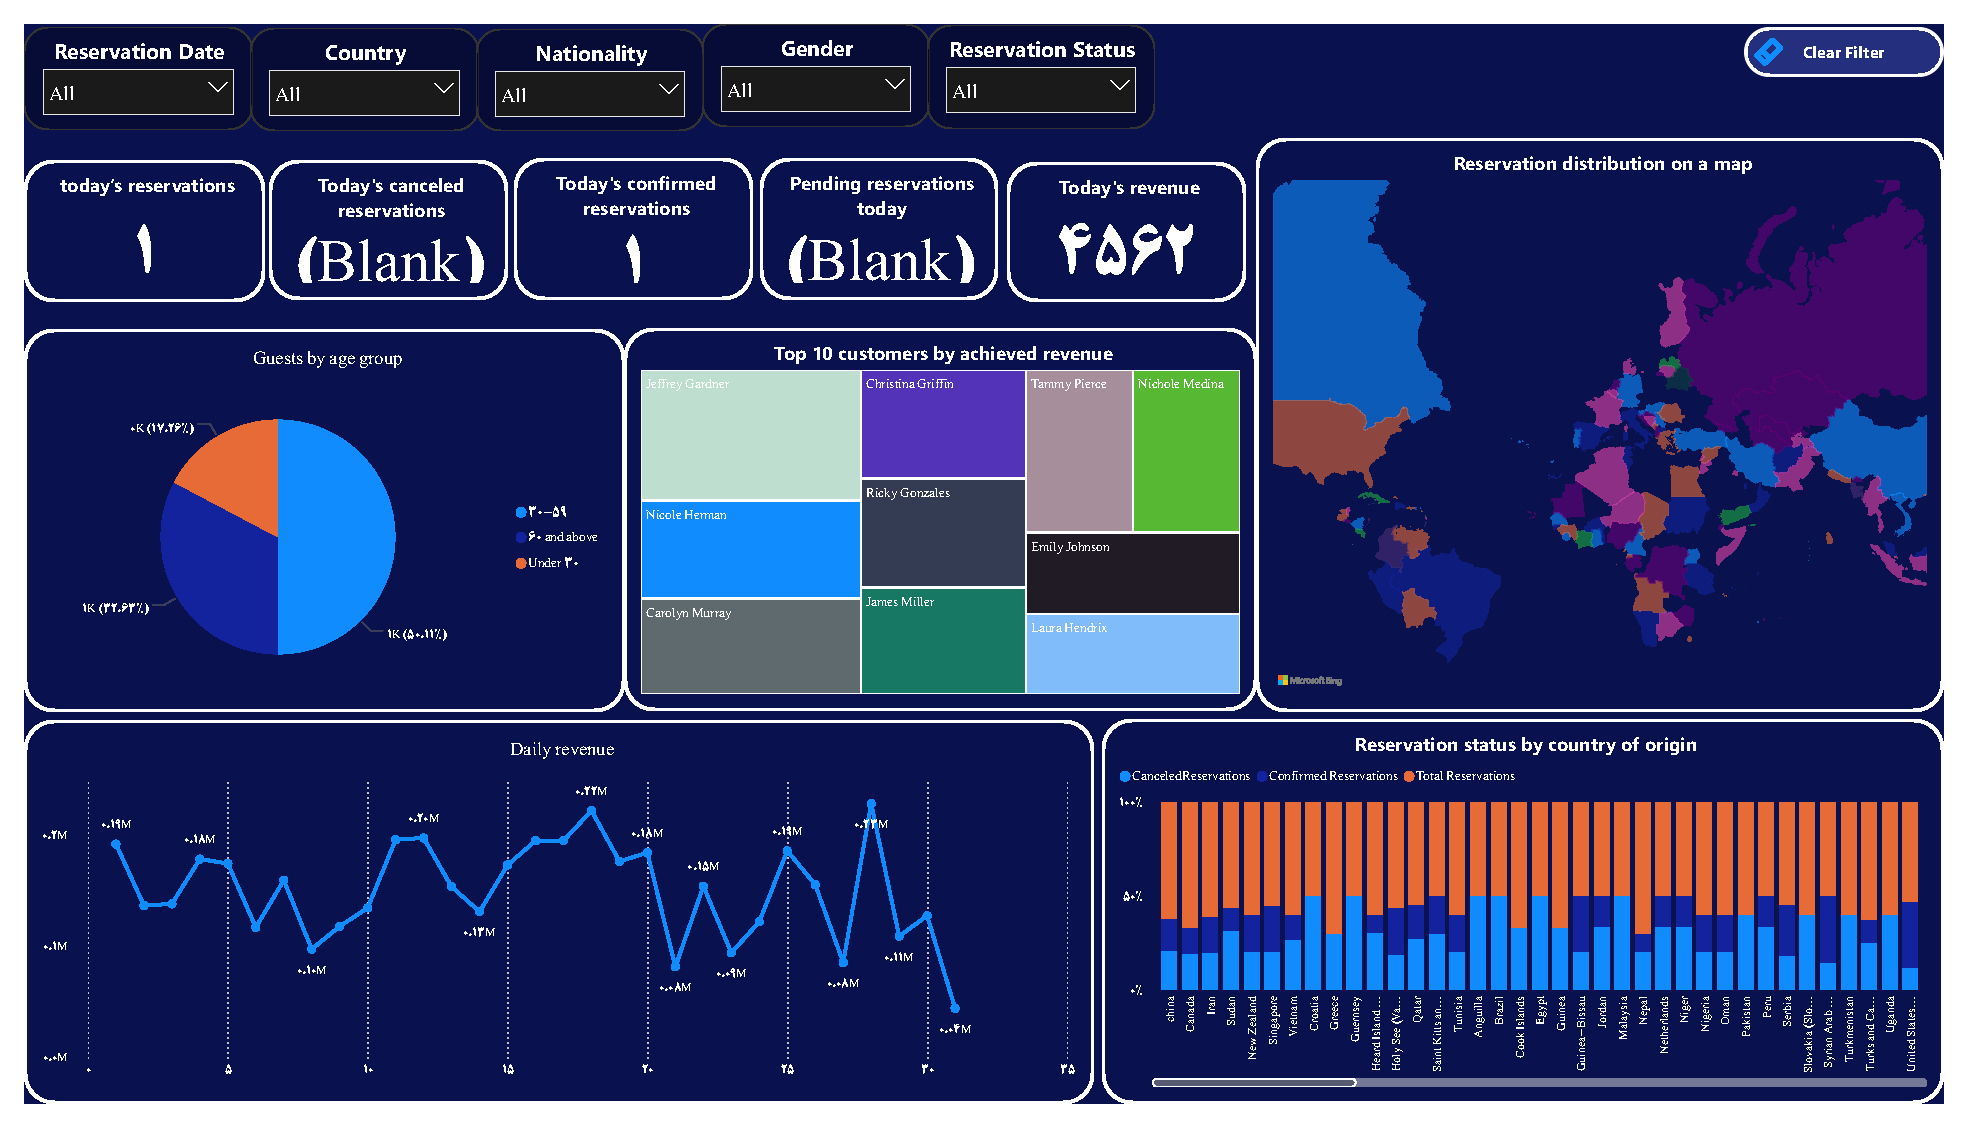
    • Guest Segmentation: Analyze guest demographics including age, nationality, gender, and customer type (e.g., new or returning) to tailor services and marketing campaigns.
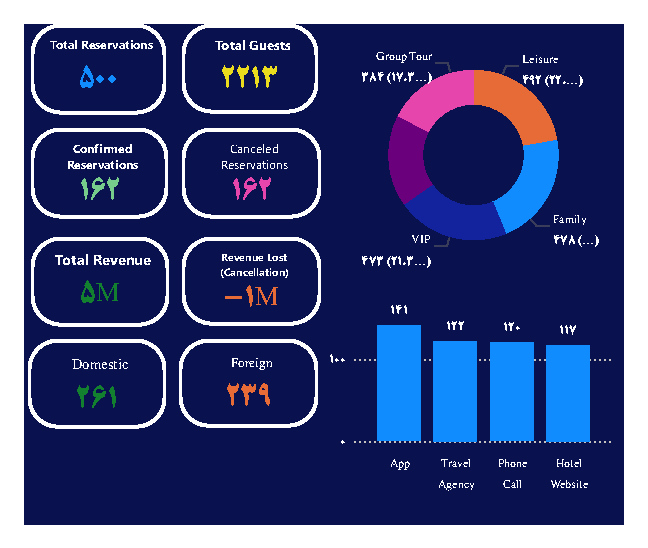
  2. Revenue and Financial Analysis:
    • Monthly and Yearly Revenue: Monitor total revenue generated from room bookings and additional services, such as room service, parking, and spa treatments, for both monthly and yearly periods.
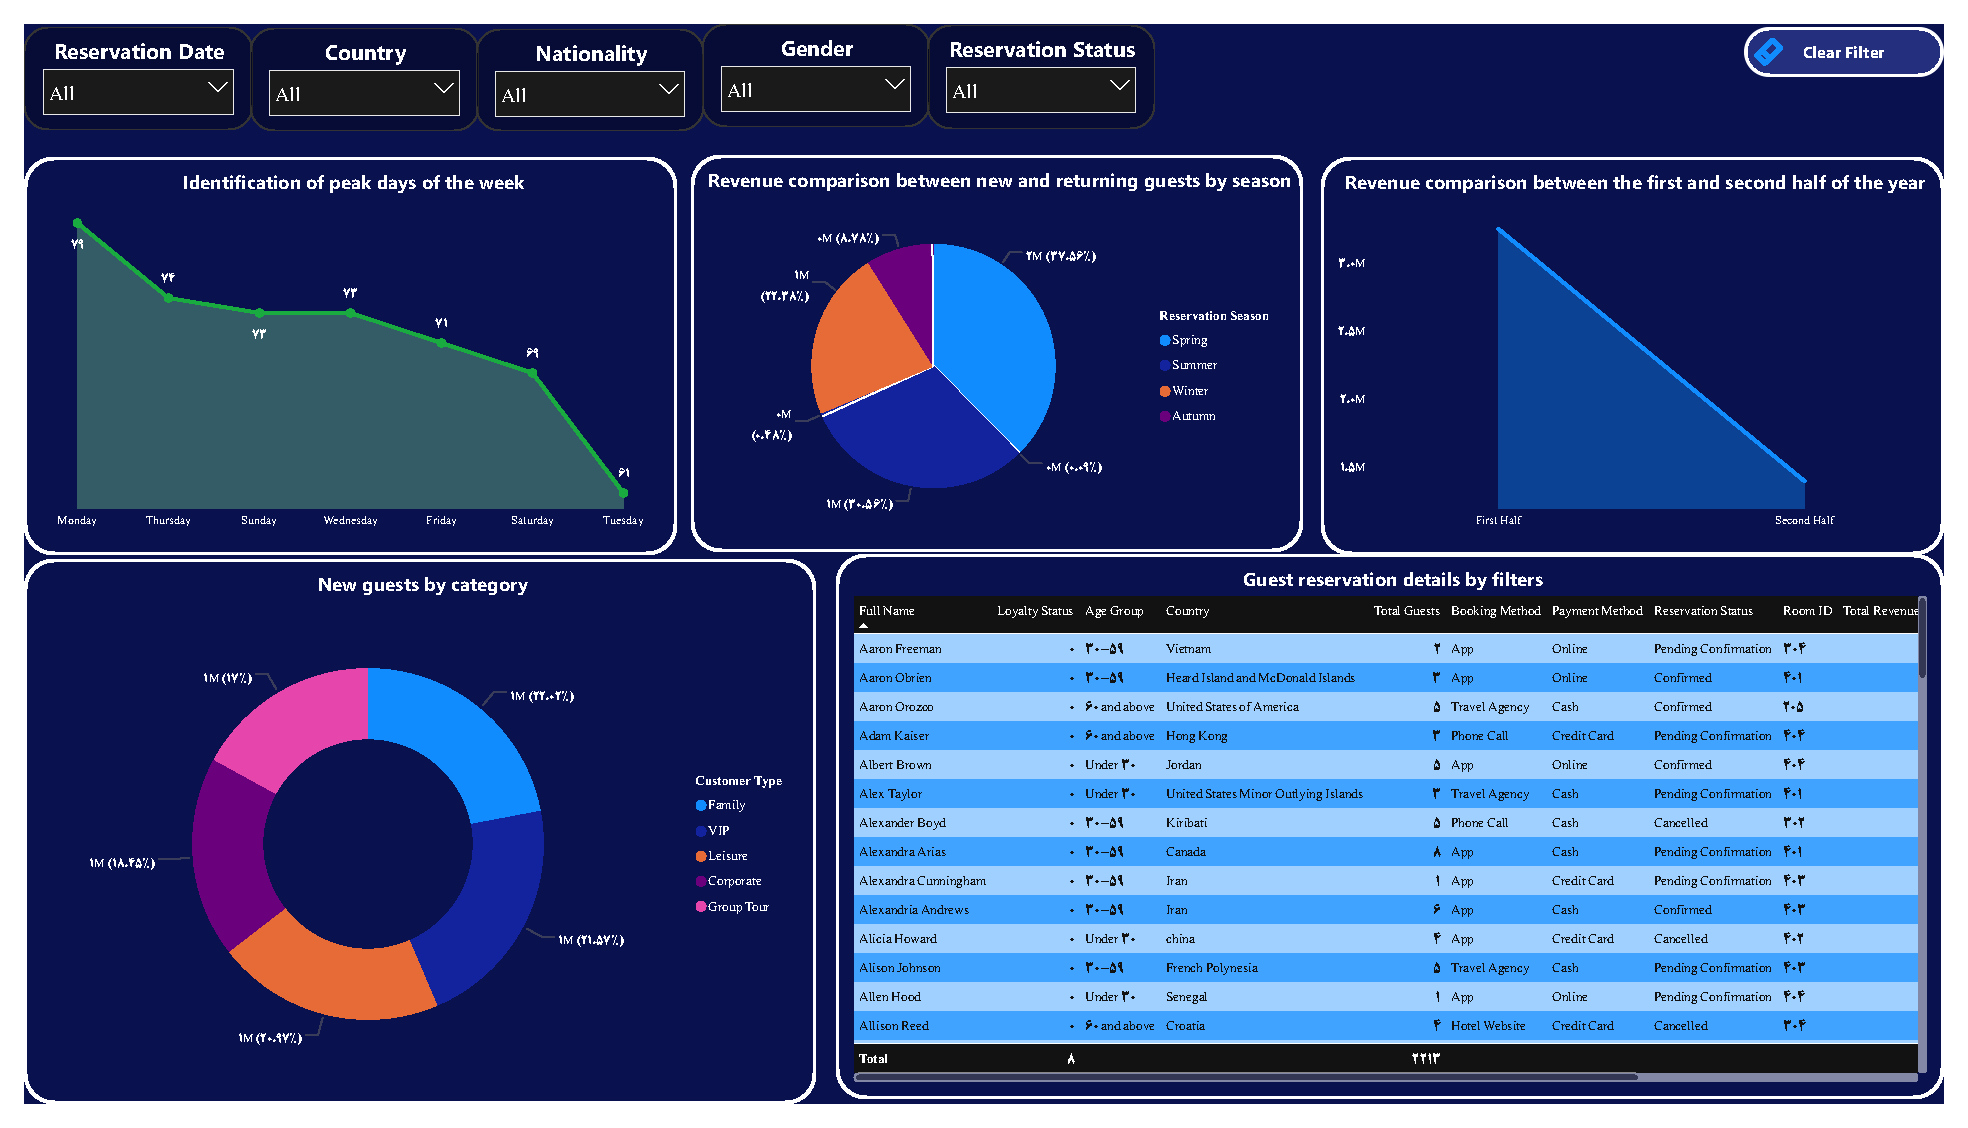
    • Revenue Breakdown: Compare revenue contributions from new vs. returning customers and track the growth rate in comparison to the same month last year.
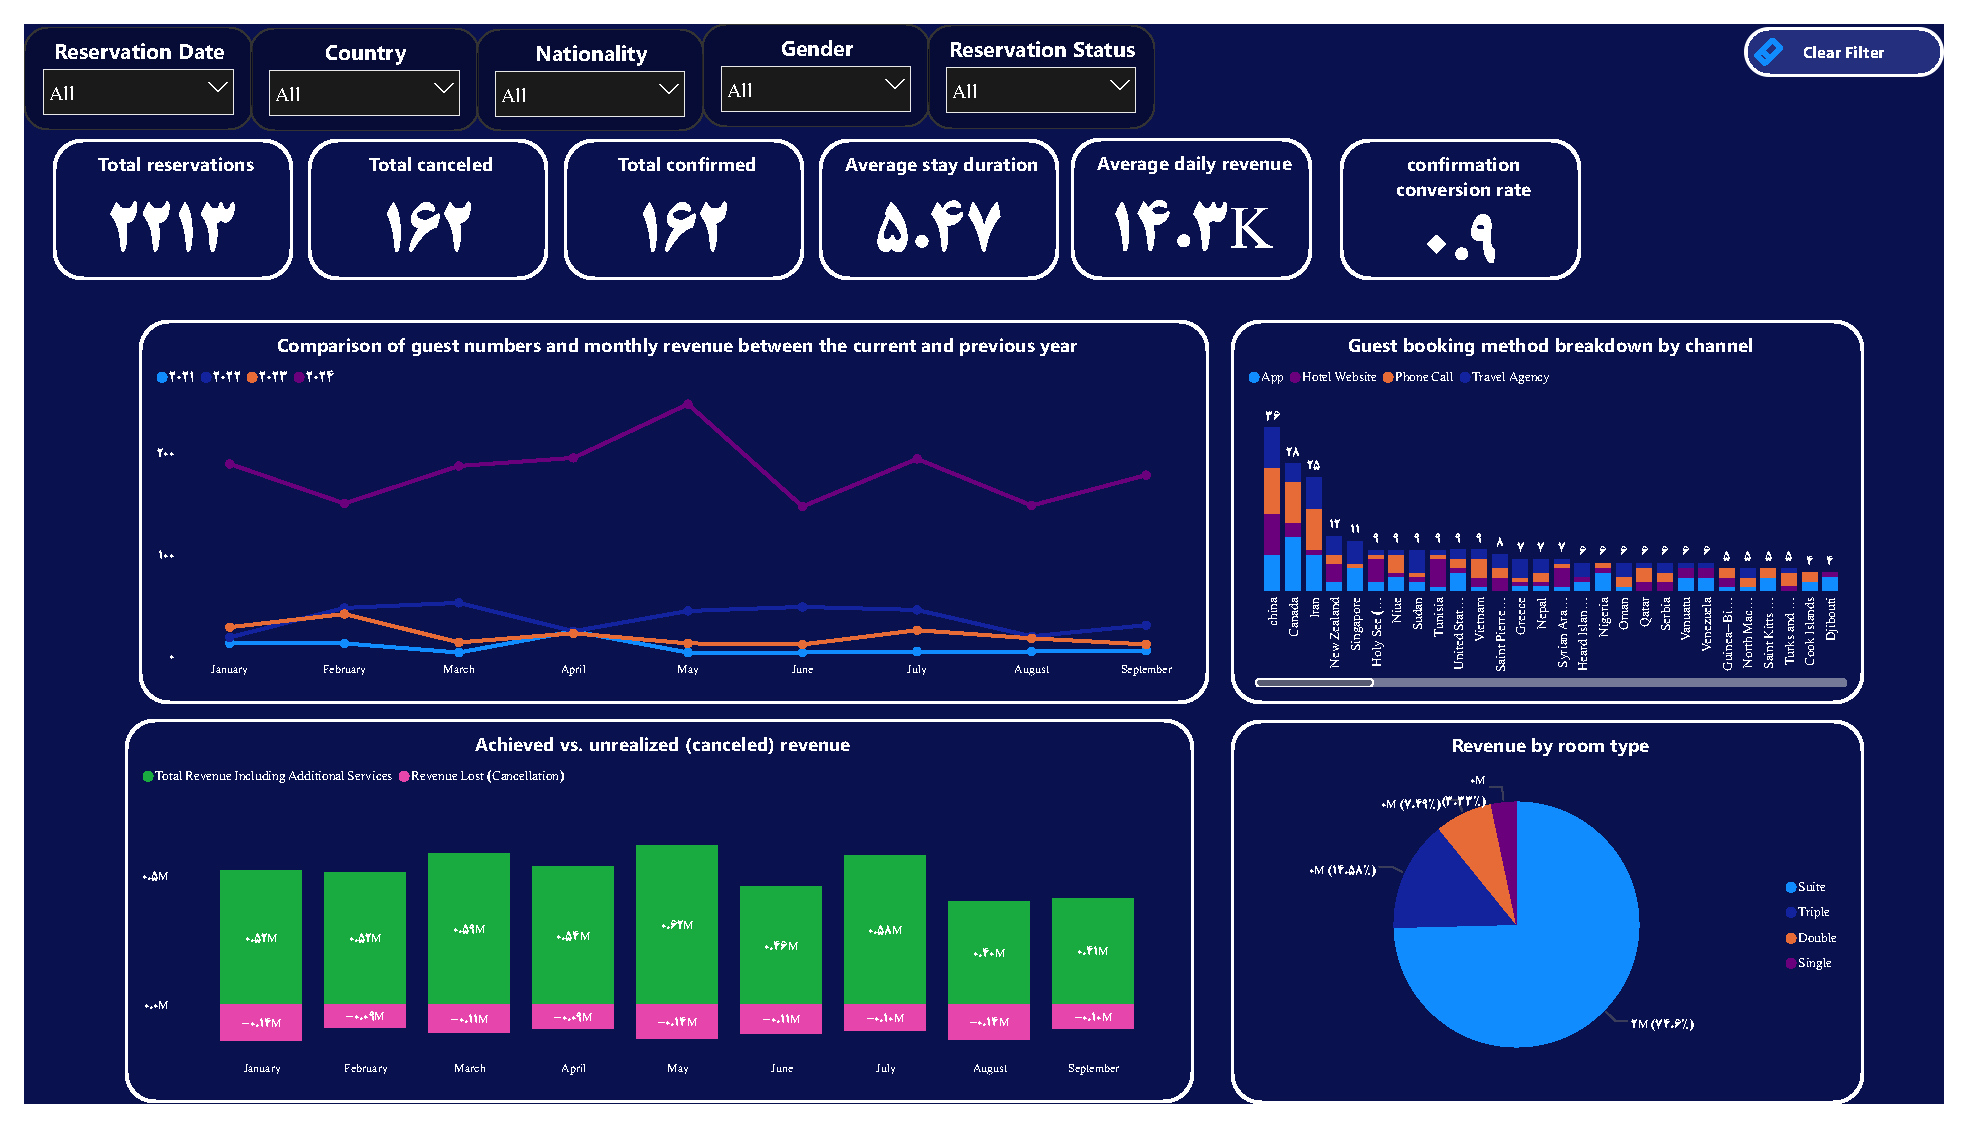
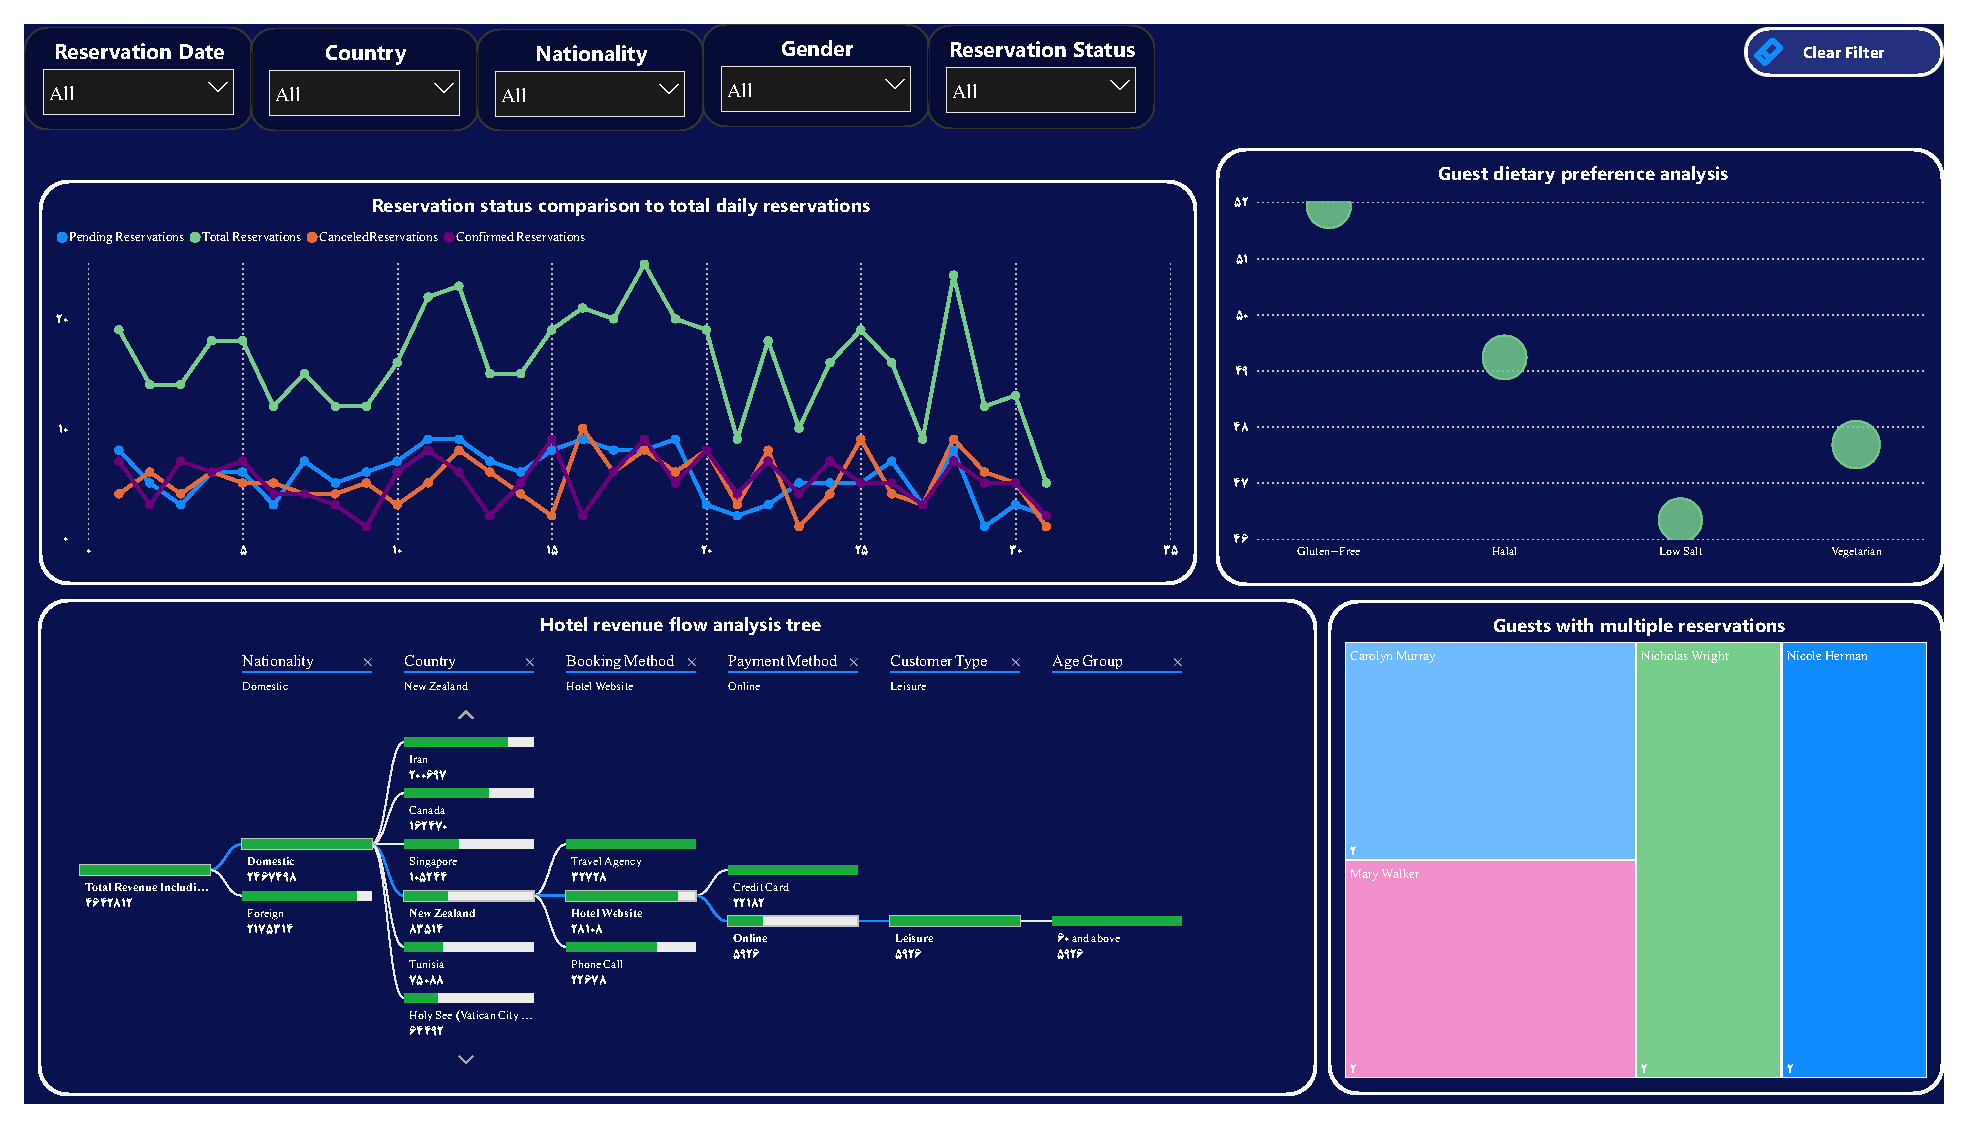
    • Canceled vs. Confirmed Reservations: Track and compare canceled and confirmed reservations to understand financial impacts and identify areas for improvement.
    • Revenue Lost from Cancellations: Identify the monetary value of canceled reservations to better assess revenue leakage.
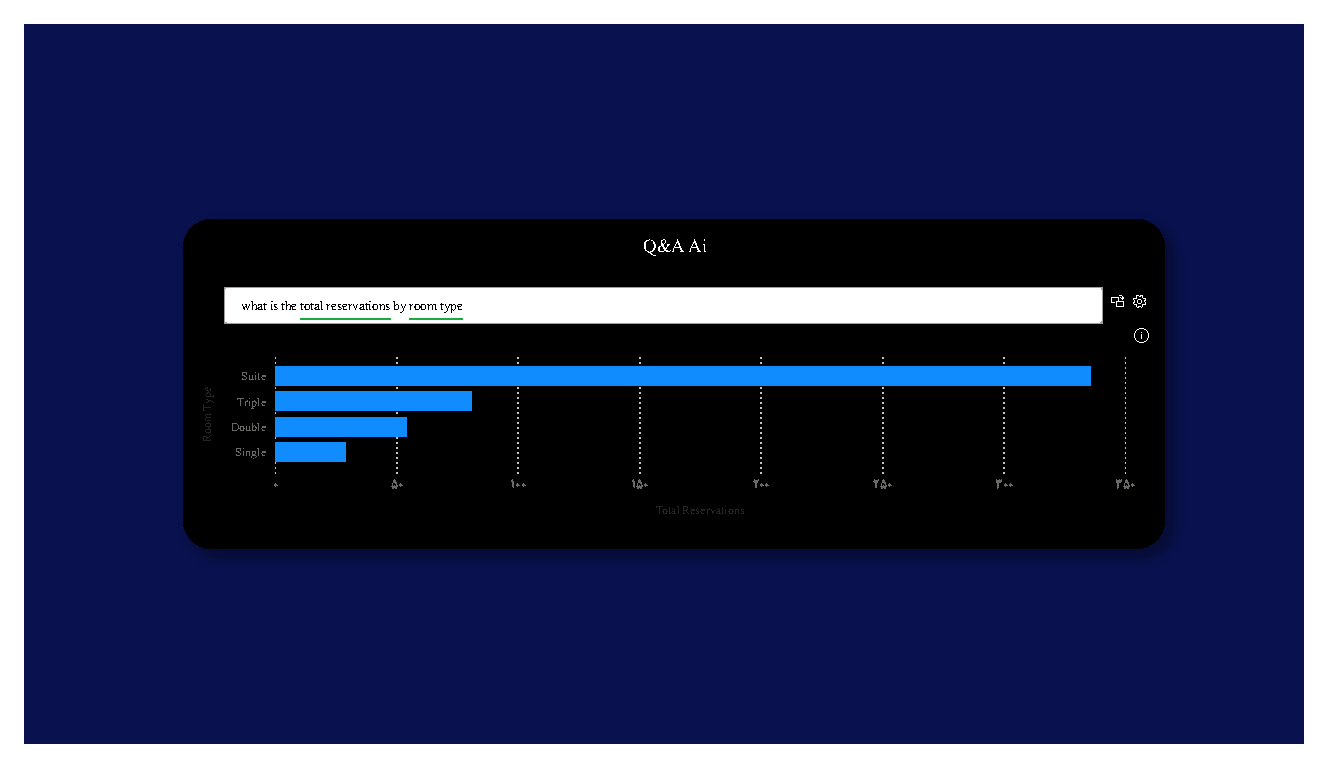
  3. Operational Efficiency:
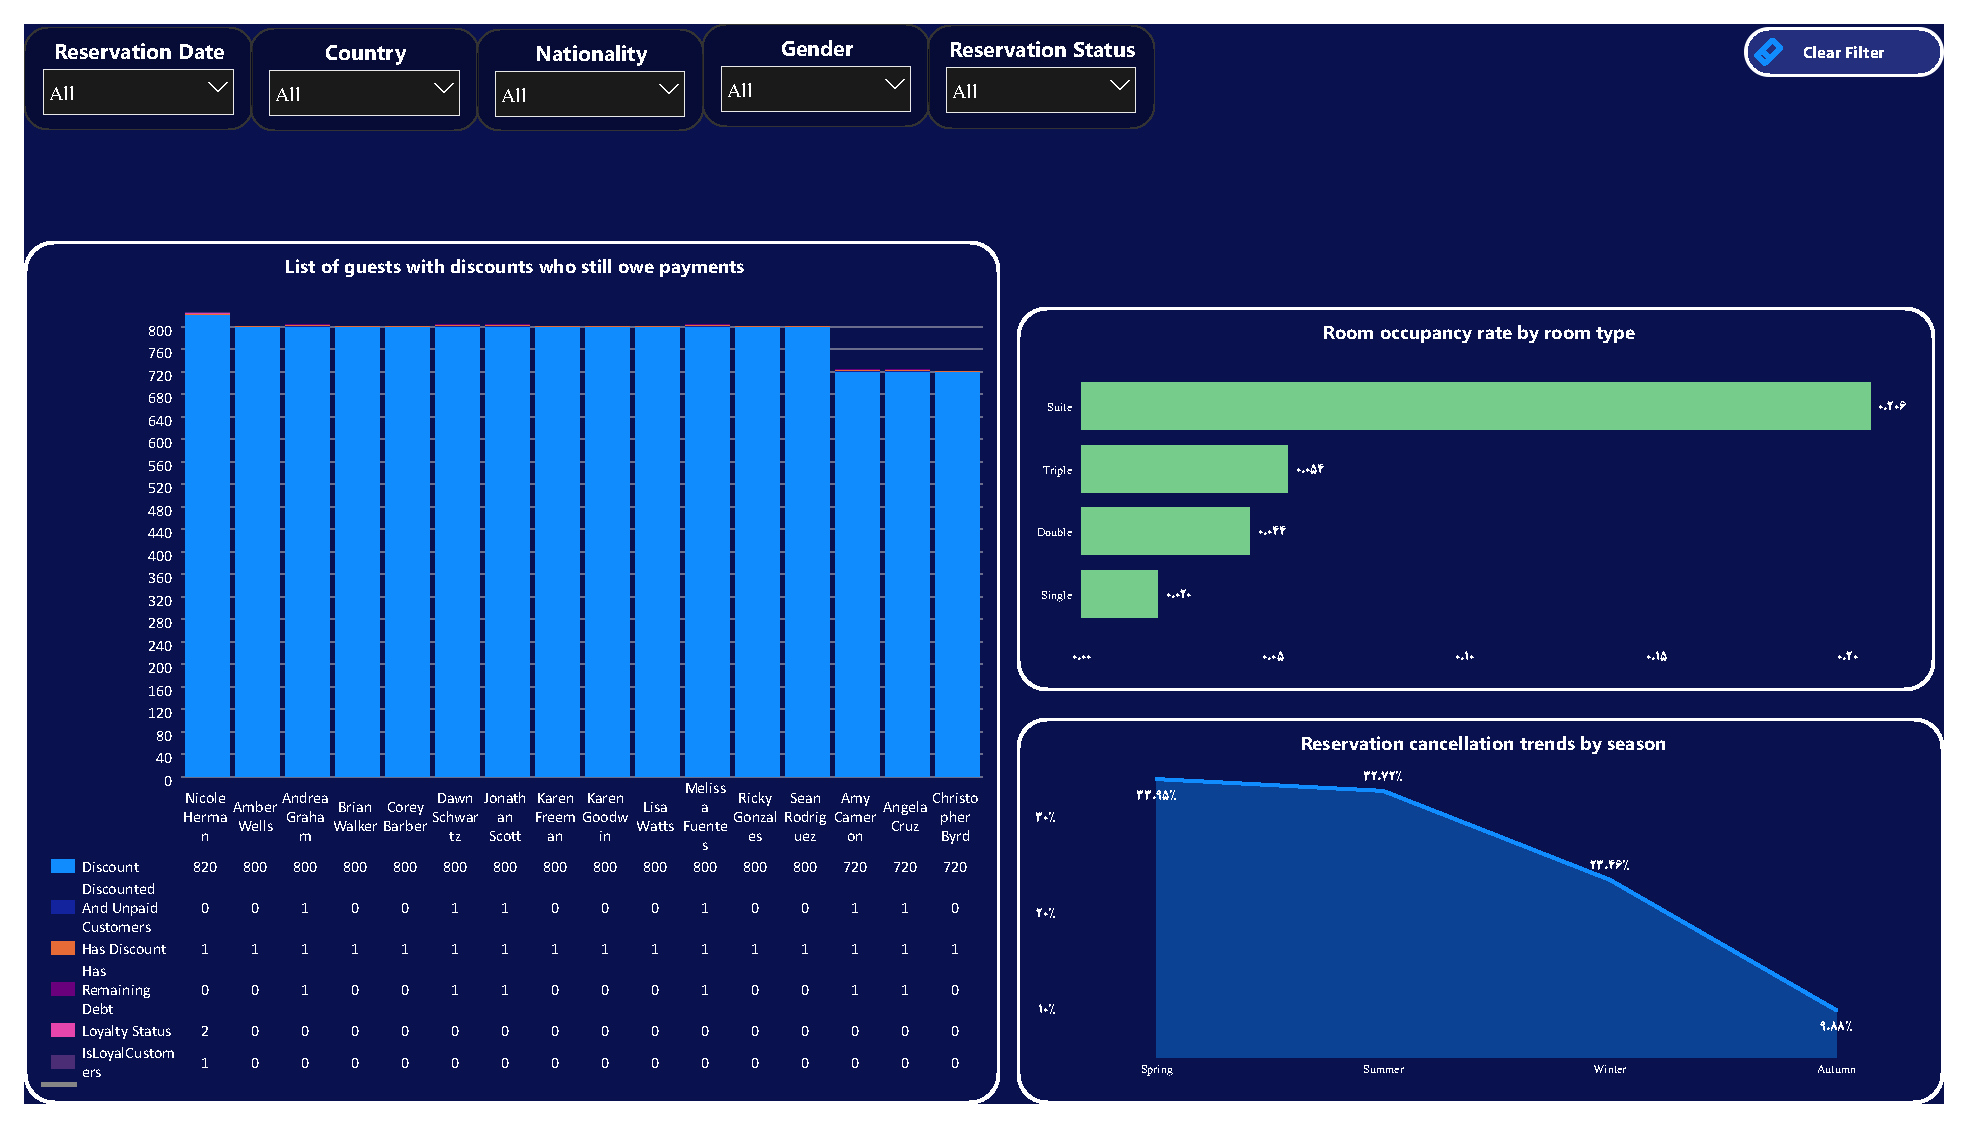
    • Occupancy Rate by Room Type: Get a clear overview of the occupancy rate for different room types (single, double, suite), and track how room categories contribute to overall revenue.
    • Average Stay Duration: Monitor the average duration of guest stays on a monthly basis to optimize resource planning and customer offerings.
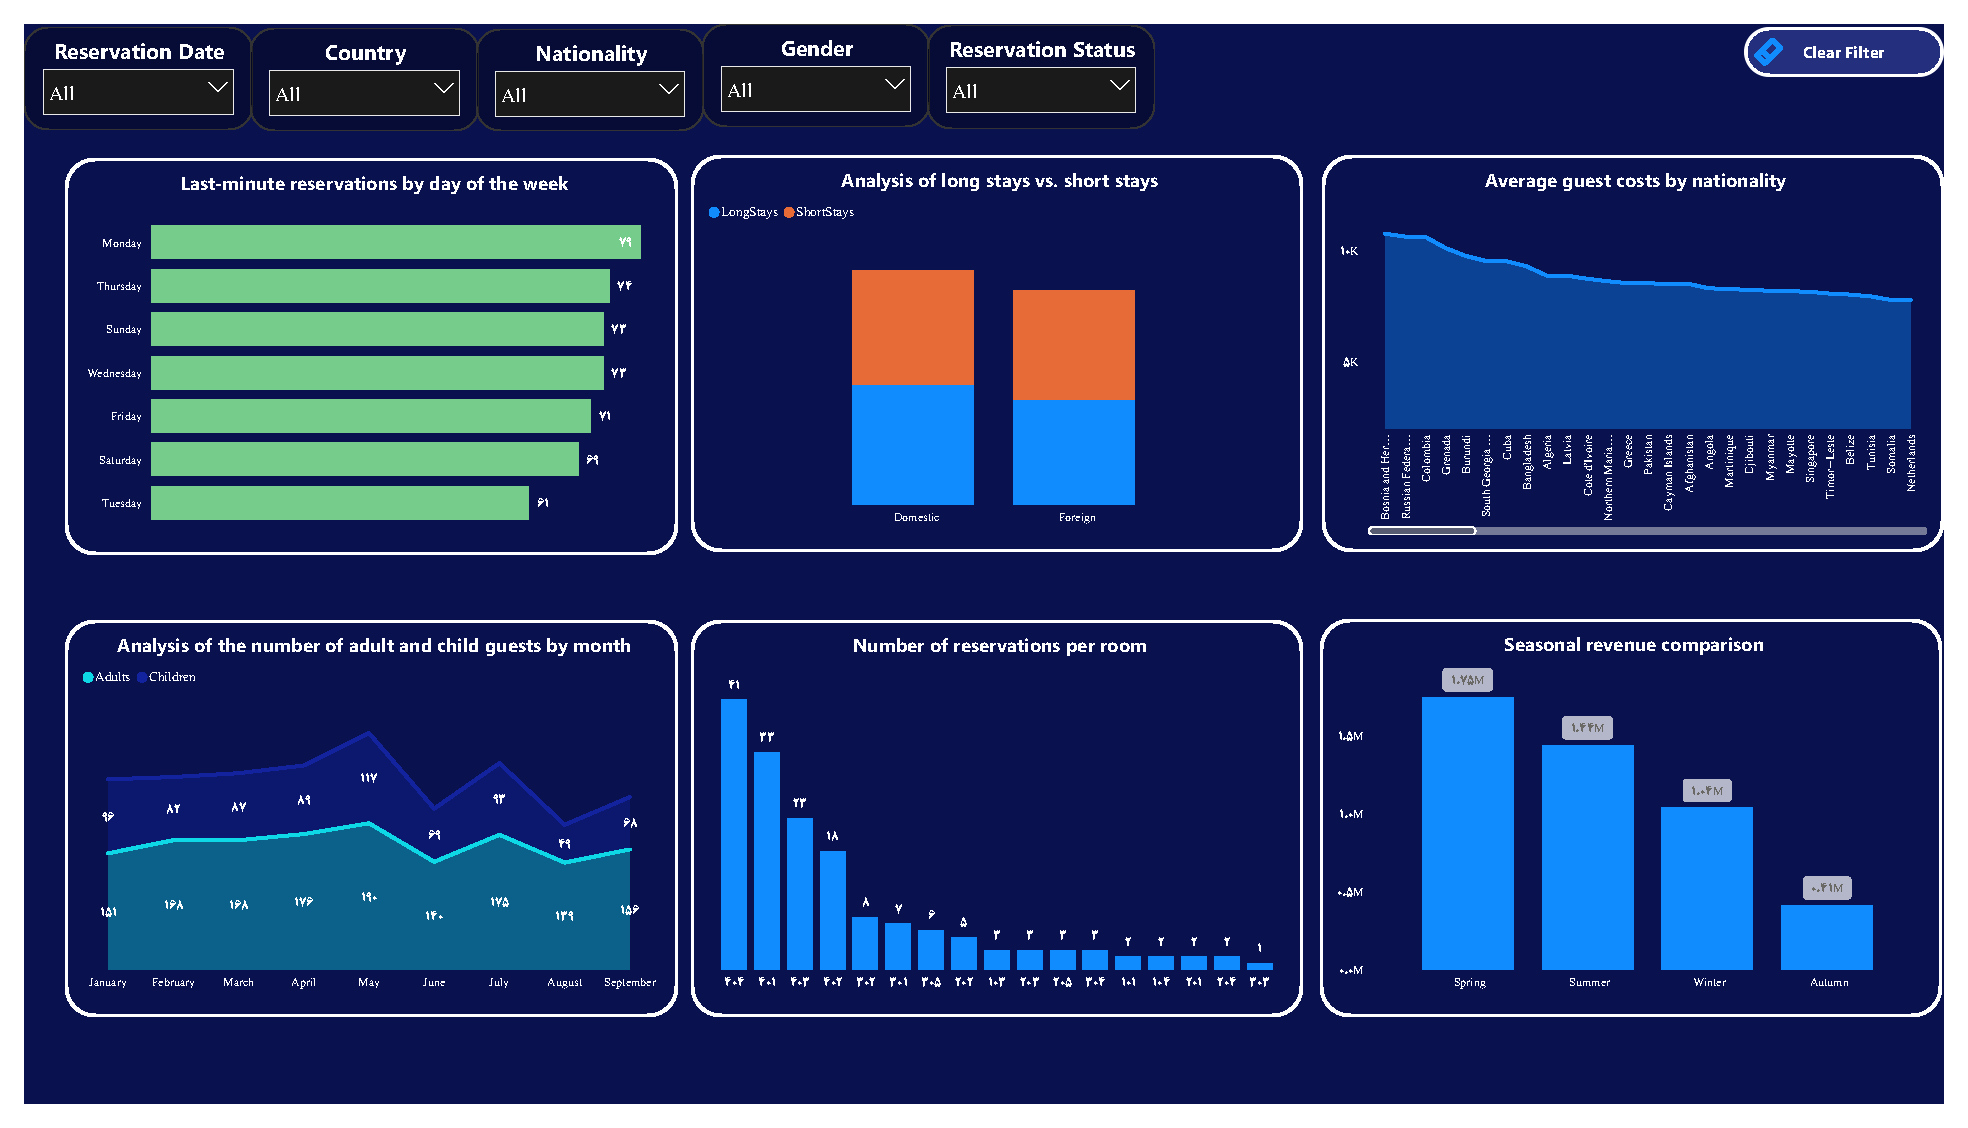
    • Last-Minute Reservations: Identify and analyze last-minute bookings (reservations made less than 2 days before check-in) to enhance room availability and booking strategies.
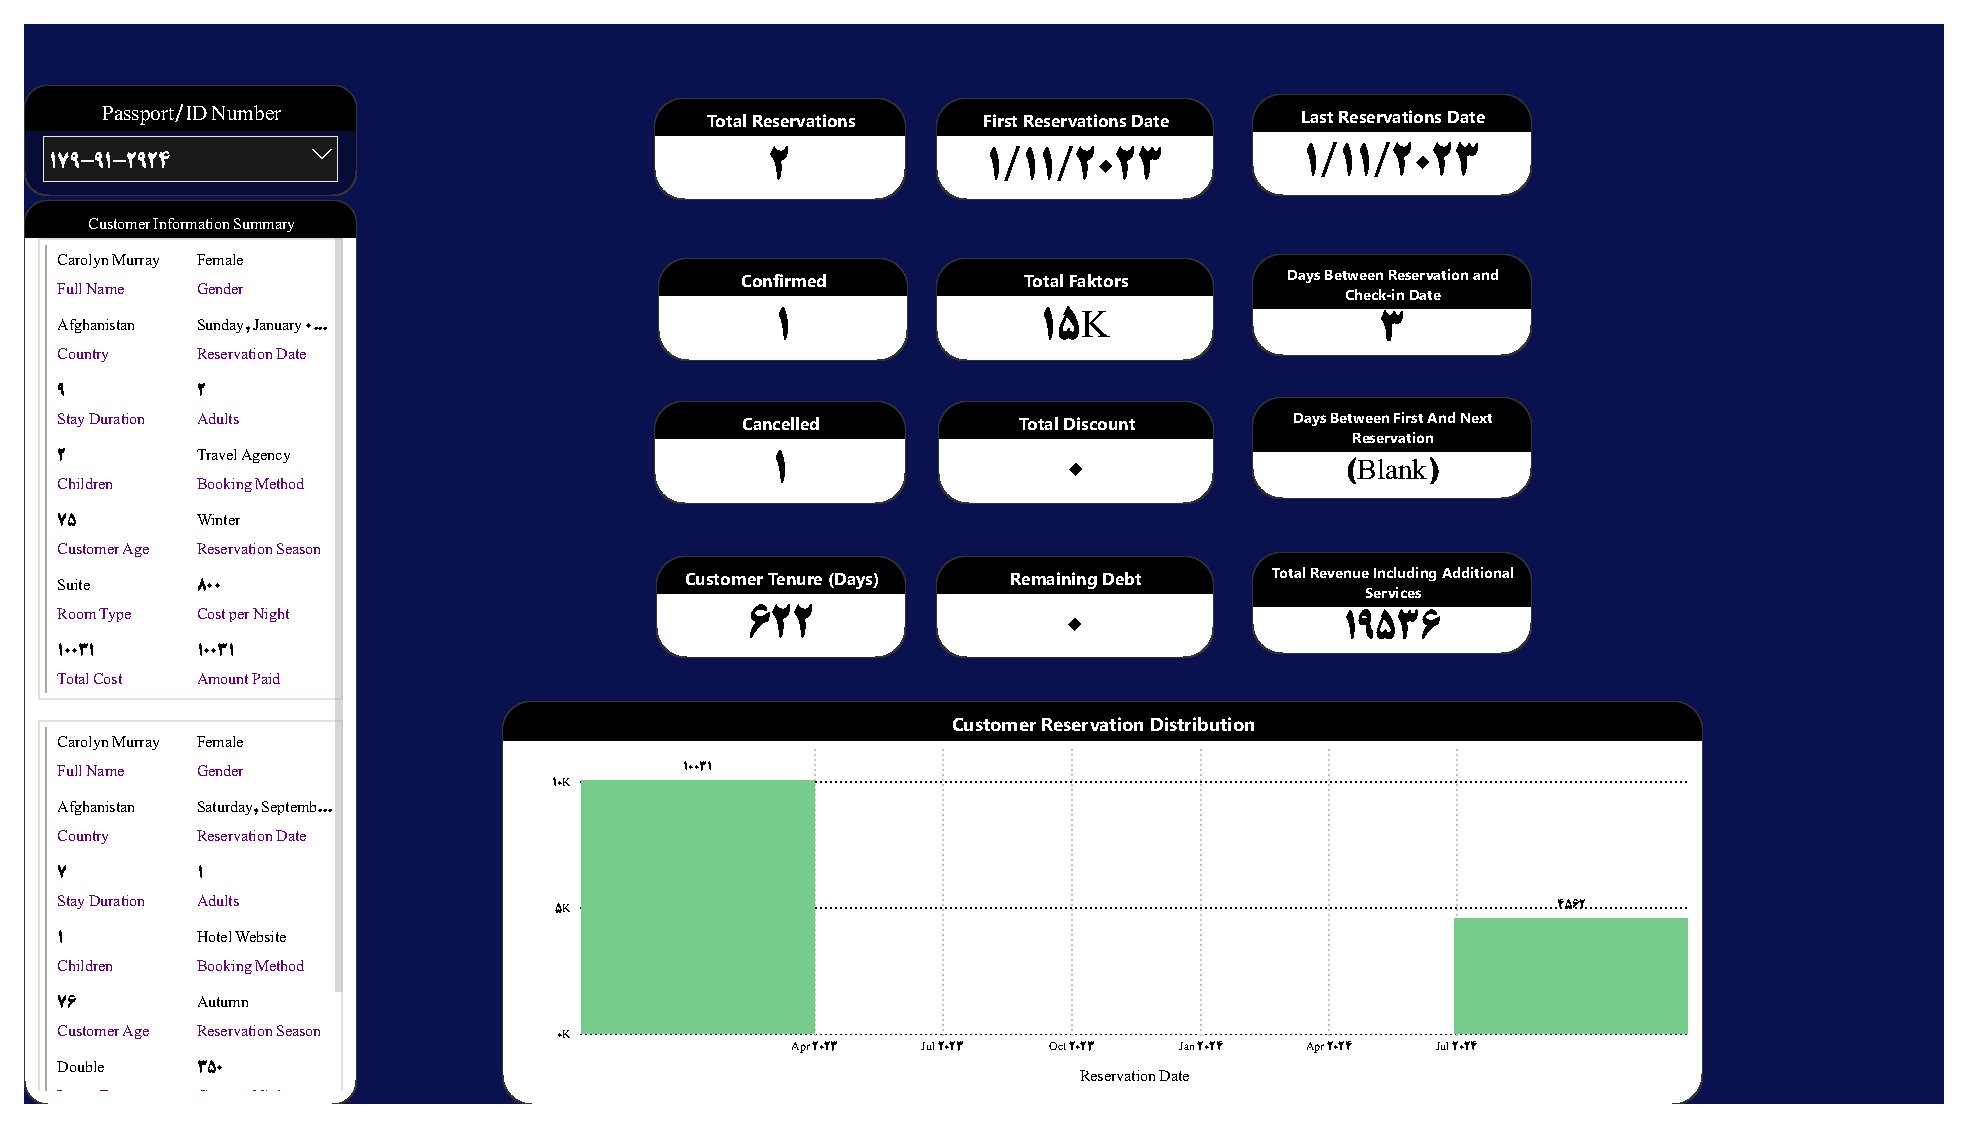
  4. Customer Loyalty and Behavior:
    • New vs. Returning Customers: Track the number of new and returning customers for the current month and year, comparing their booking frequency, spending behavior, and loyalty.
    • Loyalty Status: Determine customer loyalty based on reservation history. Customers with two or more bookings are considered loyal.
    • Customer Tenure: Measure customer loyalty over time by calculating the number of days since their first booking.
  5. Financial Status and Discounts:
    • Outstanding Payments: Track guests with unpaid balances to better manage revenue collection and outstanding debt.
    • Discounted and Unpaid Customers: Identify customers who received discounts but still owe payments, allowing for targeted follow-up and financial control.
  6. Booking and Distribution Channels:
    • Booking Methods: Monitor guest reservations by booking channel (online, phone, in-person) to identify the most effective booking sources.
    • Channel Performance: Analyze the importance of distribution channels in terms of guest numbers and revenue, enabling hotels to optimize marketing and partnerships.
  7. Customizable Filtering and Reporting:
    • Apply dynamic filters based on reservation date, guest origin, nationality, gender, and reservation status to get customized views of key data points.
    • Generate detailed reports, including total bookings, revenue trends, guest demographics, and room performance to inform strategic decisions.
  8. Advanced Analysis:
    • Seasonal Performance: Compare performance across different seasons to understand high-demand periods and adjust offerings accordingly.
    • Reservation Conversion Rate: Measure the conversion of pending reservations to confirmed bookings to optimize the reservation process.
    • Long vs. Short Stays: Analyze the proportion of long stays (greater than 5 days) versus short stays (5 days or fewer) and their impact on revenue.
  9. Guest Preferences:
    • Dietary Preferences: Gain insights into guest dietary requirements (e.g., vegetarian, gluten-free) to provide tailored services.
    • Adult vs. Child Guests: Understand the composition of guests (adults vs. children) and adjust services and amenities accordingly.
  10. Real-Time Updates:
    • Today’s Reservations: Track real-time data on reservations made for the current day, including confirmed, pending, and canceled bookings.
    • Daily Revenue: Monitor daily revenue, providing immediate insight into current-day financial performance.

Hotel Performance Dashboard Benefits:

  • Optimized Decision-Making: Gain a full view of hotel performance across multiple dimensions, allowing for informed decisions that improve both operations and guest satisfaction.
  • Enhanced Guest Experience: Use insights into guest behavior, preferences, and demographics to tailor services and deliver personalized experiences.
  • Increased Revenue and Profitability: Track revenue drivers, identify high-value guests, and optimize room occupancy to maximize revenue while minimizing operational costs.
  • Improved Financial Control: Monitor discounts, outstanding payments, and canceled reservations to ensure financial health and optimize cash flow.


Additional information

Date Published

2024

Format

pbix

Editable

Yes

Product ID

pbi45

Size

2 mb

Software

PowerBI

Reviews

There are no reviews yet.

Be the first to review “Hotel Performance Dashboard in Power BI”

Your email address will not be published. Required fields are marked *

Reviews

There are no reviews yet.

Be the first to review “Hotel Performance Dashboard in Power BI”

Your email address will not be published. Required fields are marked *